
The Consultation Conversion report shows how many of your consultations turn into paying clients, broken down by the staff member who held the consultation. Use it to see who converts best, how much converted clients go on to spend, and which consultations didn’t lead to treatment.
Step 1: Open the Report
- In the left sidebar, hover over Analytics and click Reports.
- Click the Appointments tab.
- Under Conversion & sources, click Consultation Conversions.
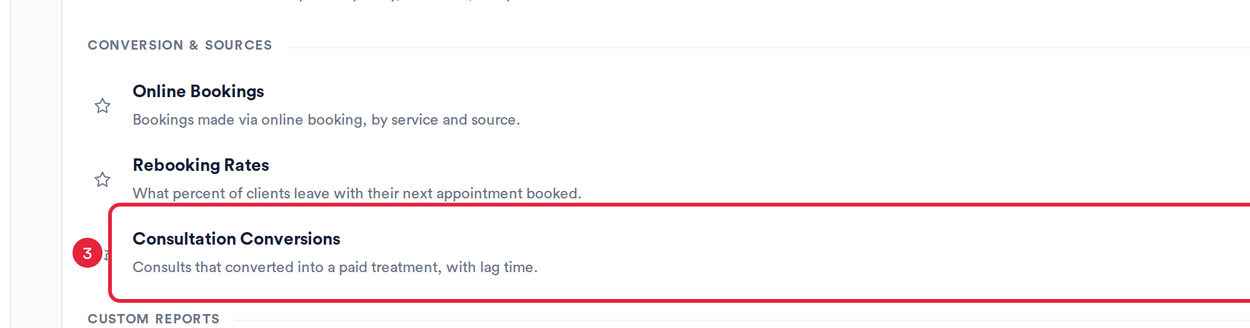
Appointments → Conversion & sources → Consultation Conversions
NOTE: The report counts any booking whose service name contains “consultation” or “new patient”, for example New Patient Consultation or Virtual Consultation. Cancelled and no-show appointments are left out, and so are consultations booked for later today.
Step 2: Choose What to Look At
The report opens on the last 30 days for every location and employee. Use the filters at the top to change that:
- Date: the period to report on. Consultations in this period are counted, and spend is measured up to the end of it.
- Location: one or more of your locations (All locations by default).
- Employee: one or more staff members. Start typing to search (All employees by default).
- Converted: show All consultations, Converted only, or Not converted.
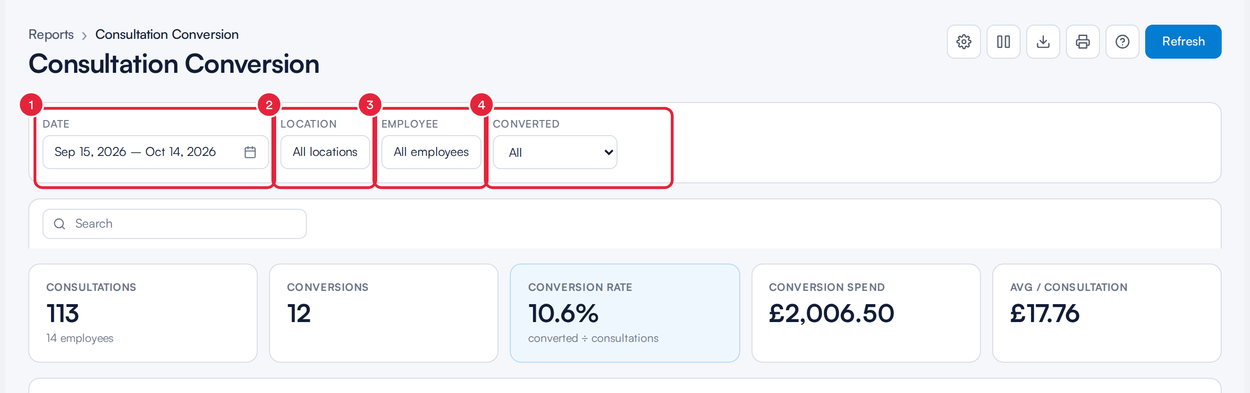
Set the date, location, employee and converted filters
Use the Search box under the filters to find a particular client, and click Refresh in the top right to reload the figures.
Step 3: Read the Summary
- The summary cards cover everything that matches your filters:
- Consultations: how many consultations took place, and how many employees held them.
- Conversions: how many of those consultations converted.
- Conversion rate: conversions divided by consultations.
- Conversion spend: the money the consulted clients paid from their consultation day on (see How Spend Is Counted below). With a threshold above 0, this also includes clients who spent too little to count as converted.
- Avg / consultation: conversion spend divided by the number of consultations.
- The Conversion rate by employee chart ranks your staff by the share of their consultations that converted, with each person’s conversion spend on the right.
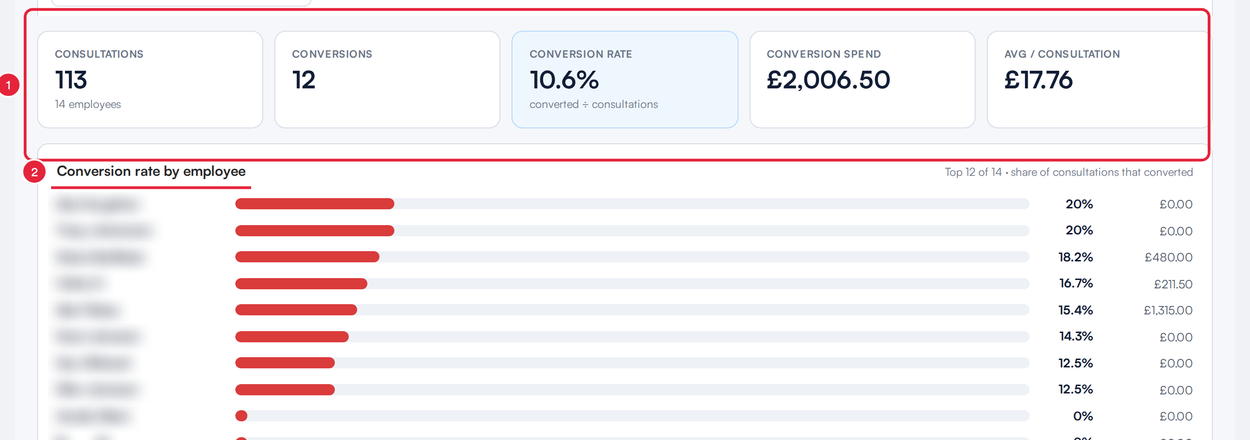
The summary cards and the per-employee chart
How Spend Is Counted
- Conversion spend is money received against the client’s invoices dated from the day of the consultation to the end of the report period, less any refunds.
- Paying with account credit, a package or a voucher isn’t new money, so a client who prepaid before the consultation and redeems it afterwards shows no conversion spend for that treatment.
- A client with several consultations in the period has their spend counted once in the totals, on their first consultation. Each consultation still counts towards Consultations.
Step 4: Review Each Employee’s Consultations
Below the chart, consultations are grouped by employee. Each group shows how many consultations that person held, how many converted, their conversion rate and their conversion spend.
- Click an employee to open their group. Each row shows the Date of Inquiry, the Client, the Consultation Type, whether it Converted (S) (Yes or No) and the Location. Click a client’s name to open their client card.
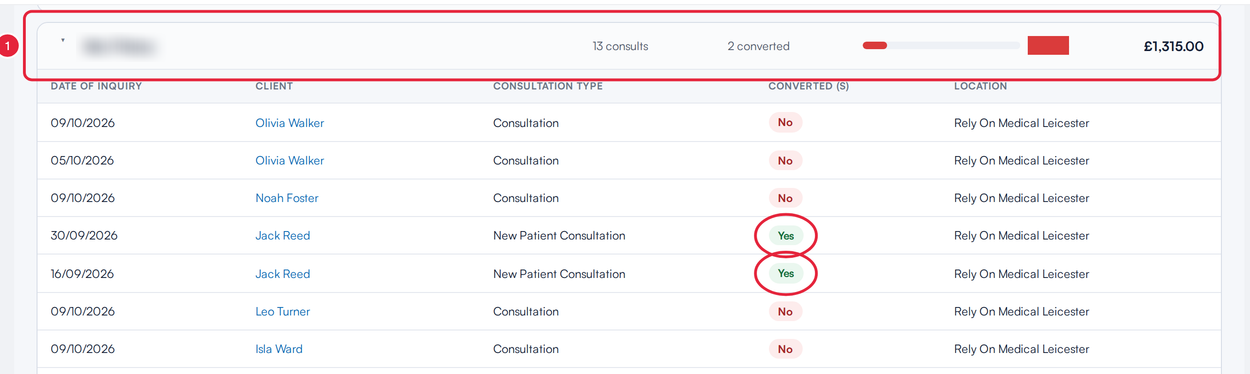
Open a group to see each consultation and whether it converted
Step 5: Set Your Conversion Threshold
The conversion threshold decides when a consultation counts as converted: the client has to spend more than this amount in the report period.
- Click the Configure conversion icon (the cog) in the top right.
- Enter an amount in Conversion threshold. Leave it at 0 to count every client who spends anything.
- Click Save. You’ll see Conversion threshold updated and the report recalculates.

The cog opens Configure conversion
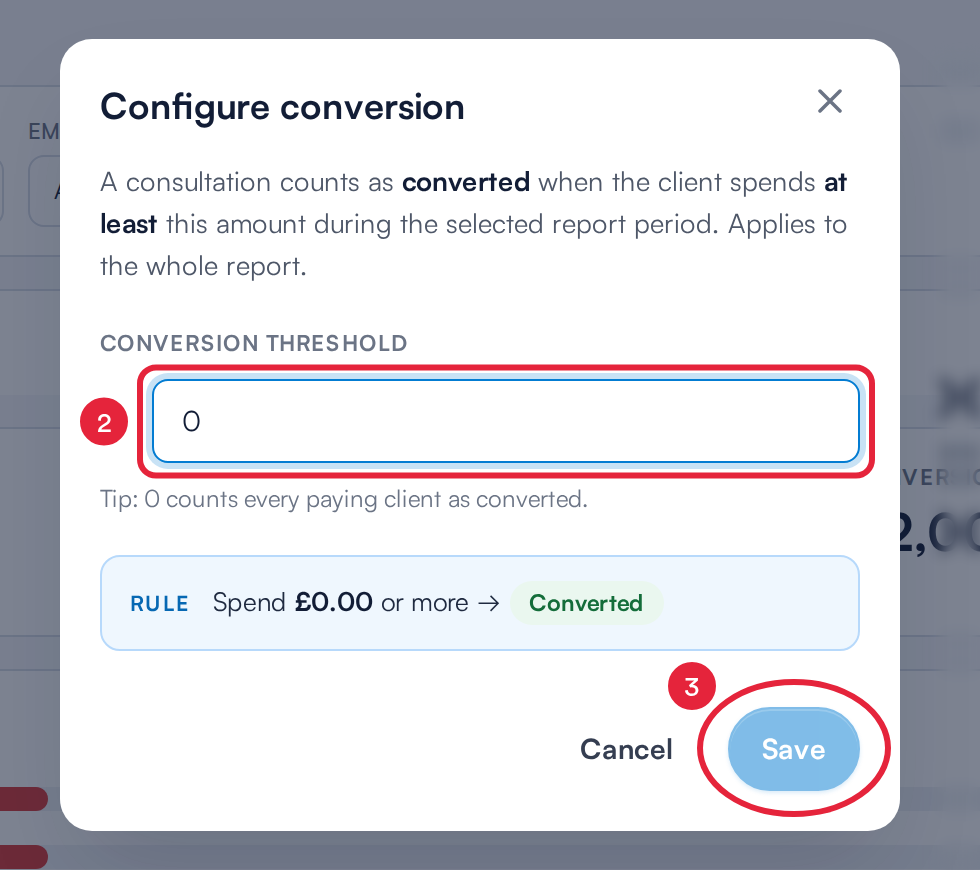
Set the amount a client must spend to count as converted
IMPORTANT: The threshold is saved for your whole clinic, not just for you, so everyone who opens this report sees results based on the same amount.
Step 6: Add Columns, Export or Get Help
- Click Columns to add client or appointment custom fields to the table, or to hide columns you don’t need.
- Click Export to download the full report as an Excel or CSV file.
- Click Help for a summary of how consultations, conversions and spend are worked out.

Columns, Export and Help
What's next?
Was this guide helpful? Let us know by voting below - your feedback helps us write clearer articles.
For more guides, browse the related articles below or use the search bar at the top of the page. You can also watch our video learning series, the Pabau Academy, or visit the Support page for additional help.