
When a client has had more than one set of lab results, you can put the two most recent side by side and see which biomarkers have improved or worsened. You can also chart any single biomarker across every result on file, to see how it has moved over months. Both are on the client’s Lab Tests tab.
Step 1: Open the Client’s Lab Tests
- Open the client’s client card.
- Open the EMR menu (called Chart for clinics in the United States) and click Lab Tests.
The tab opens on Lab insights for the latest result, with the client’s lab requests and results listed below it.
Step 2: Compare the Two Most Recent Results
- Click Compare results, above the list of requests.
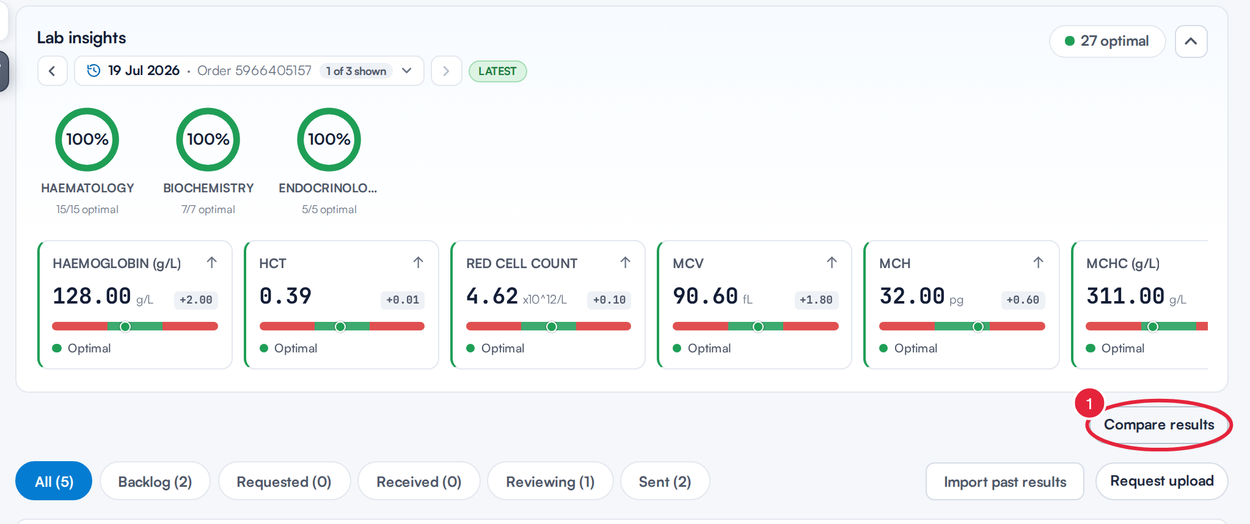
Compare results sits above the client’s lab requests
The Results comparison opens below the button. It uses the client’s two most recent compatible results and shows only the biomarkers measured in both.
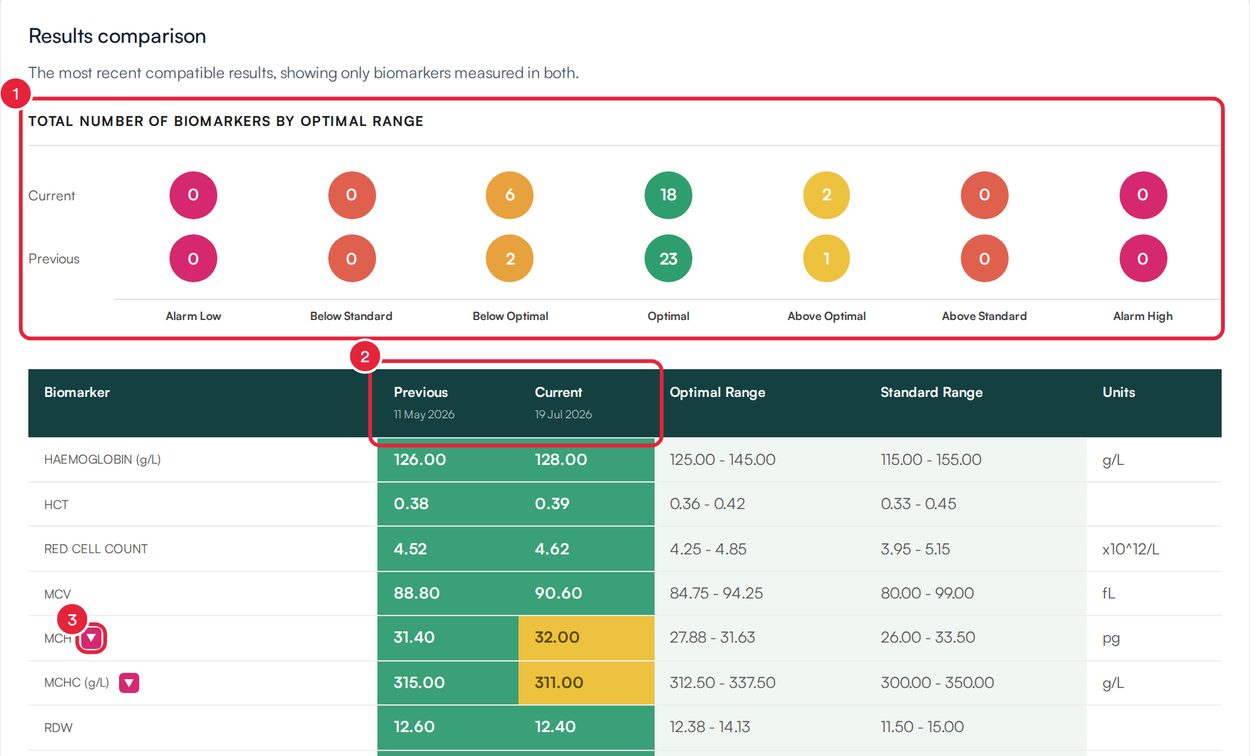
The comparison summary, the Previous and Current columns, and a Worsened marker
Here is how to read it:
- Total number of biomarkers by optimal range counts how many biomarkers fall in each band (from Alarm Low through Optimal to Alarm High) for the Current result and the Previous one, so you can see at a glance whether the picture is getting better.
- The table lists each biomarker with its Previous and Current values (with the date of each result), the Optimal Range, the Standard Range and the Units. The standard range is the lab’s own range, and the optimal range is the middle half of it. Each value is coloured by the band it falls in.
- A marker appears next to a biomarker when either value sits outside its optimal range. A green ▲ means it has Improved: the value has moved closer to the optimal range since the previous result. A pink ▼ means it has Worsened: it has moved further away.
Click Hide comparison to close it again.
NOTE: A comparison needs at least two results with matching biomarkers, numeric values, units and reference ranges. If there aren’t two such results, the Compare results button is greyed out, and hovering over it tells you why. Results reported in different units are never combined.
TIP: If your clinic has set its own ranges for a biomarker in Setup, the comparison uses them instead of the lab’s range and marks the row Clinic range. The lab’s own report is never changed.
Step 3: See One Biomarker Over Time
- Click the expand button on the right of a received result to open its values.
- Click the name of the biomarker you want to follow, for example HAEMOGLOBIN.
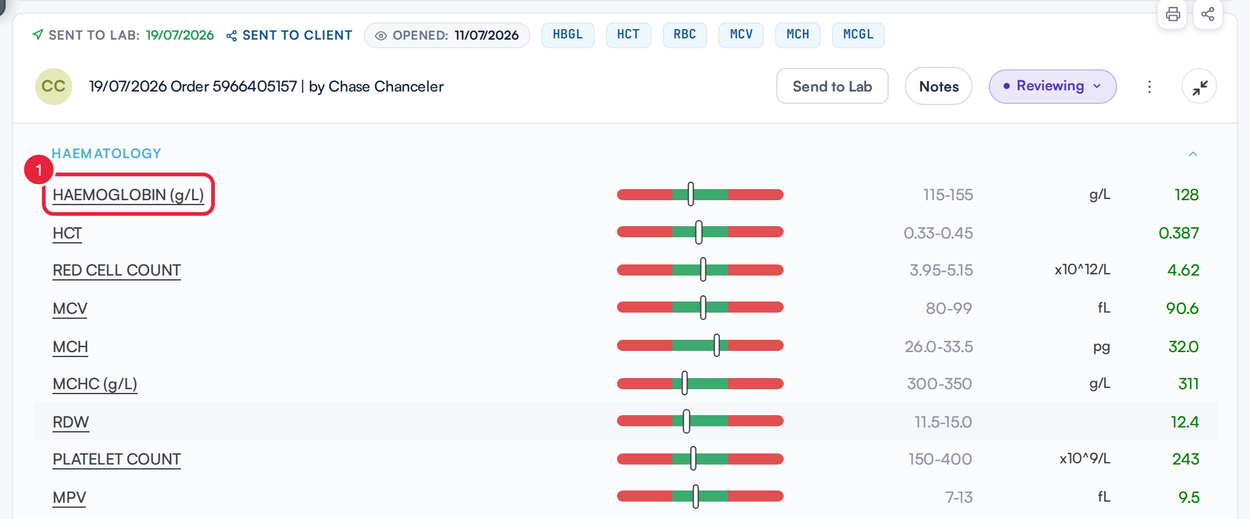
Each biomarker name in an opened result is a link to its history
The <biomarker> over time chart opens. Each point is a saved result for this client. The shading behind the line shows the lab’s range at the time of each result, so you can see when a value was Within range, Below range or Above range. Labs sometimes change their ranges between results, and the shading follows those changes.
Step 4: Change the Biomarker or the Dates
- Pick another biomarker from the Biomarker list. Each entry shows how many readings the client has and how many were out of range.
- To look at part of the history, set a From date and a To date. Click All dates to see the whole history again.
- Click View all measurements to see every reading in a table, with its date, result, the lab’s range and whether it was in range.
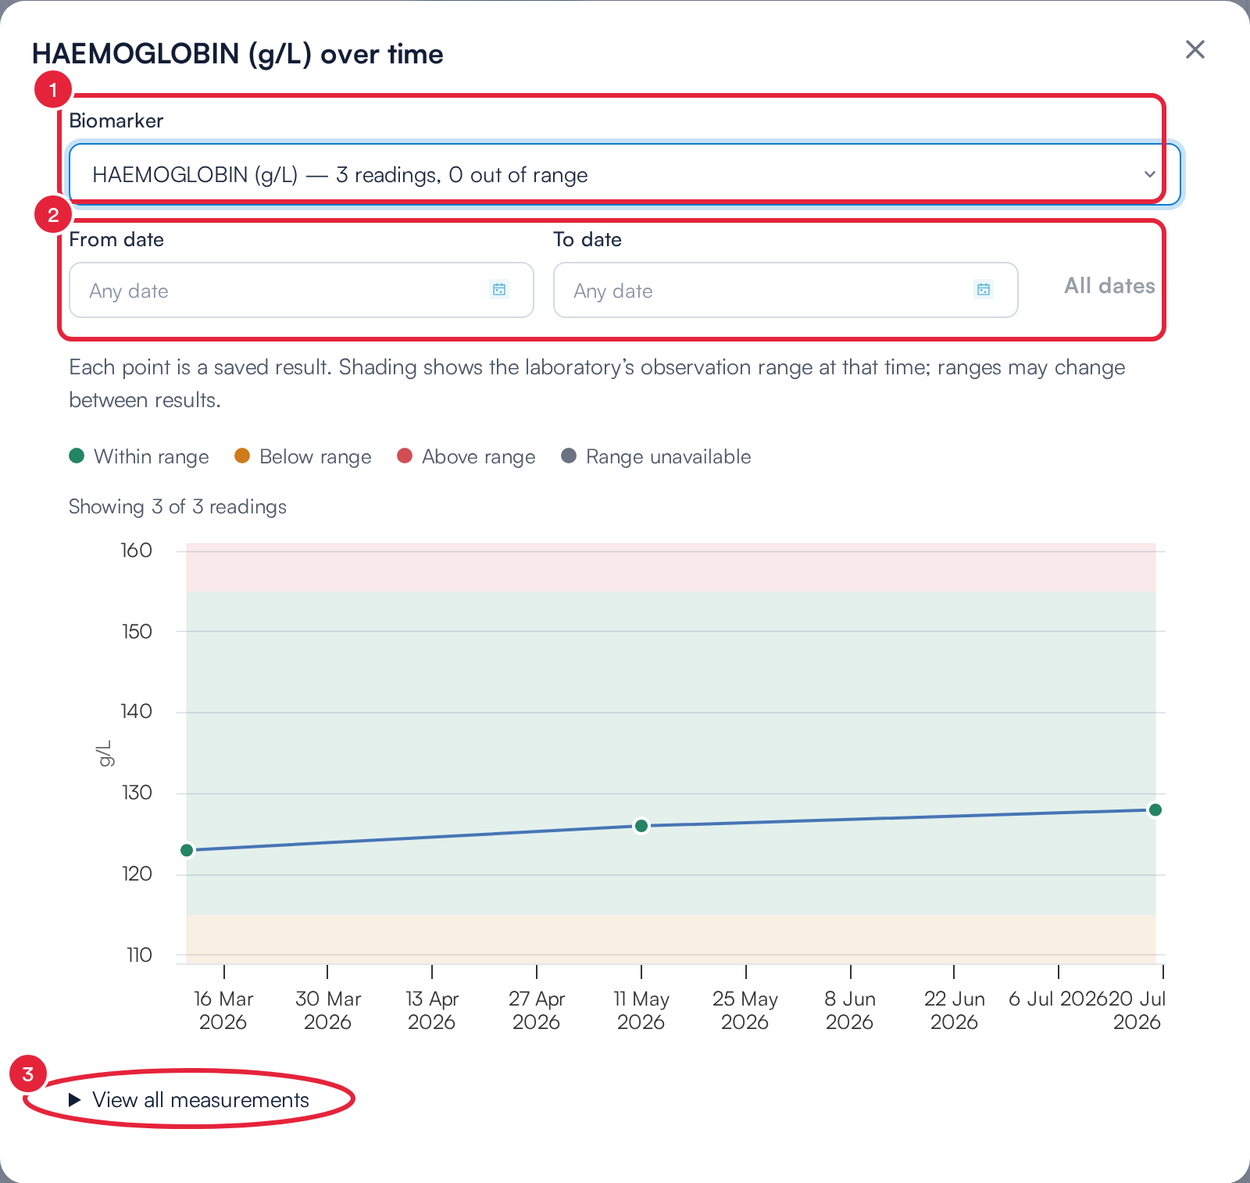
Switch biomarker, narrow the dates, or open the full table of readings
What's next?
- How to Review and Share Lab Results (New Client Card)
- How to Print and Send Lab Results (New Client Card)
- Labs (New Client Card)
Was this guide helpful? Let us know by voting below - your feedback helps us write clearer articles.
For more guides, browse the related articles below or use the search bar at the top of the page. You can also watch our video learning series, the Pabau Academy, or visit the Support page for additional help.