
Clients like to book when it suits them — often in the evening or at the weekend, when your reception is closed. Online Bookings lets them do that, and the Online Bookings dashboard shows you how it is going: whether your page is live, what is holding bookings back, and where each booking came from.
In this article, you will learn how to read the Overview and Analytics tabs of the Online Bookings dashboard.
Step 1: Open the Online Bookings Dashboard
In the left sidebar, click More → Online Bookings (or go to Setup → Online presence → Online Bookings). The dashboard opens on the Overview tab.
- The status next to the title reads Online when your booking page is published, and Offline if it has never been published.
- The main button changes with your page’s state. When all is well it is Share your booking page. If the page has never been published you see Resume online booking, which opens Pabau Studio so you can publish it. If something is stopping clients paying, you see Connect payments.
- Review setup opens your full readiness checklist (Step 3).
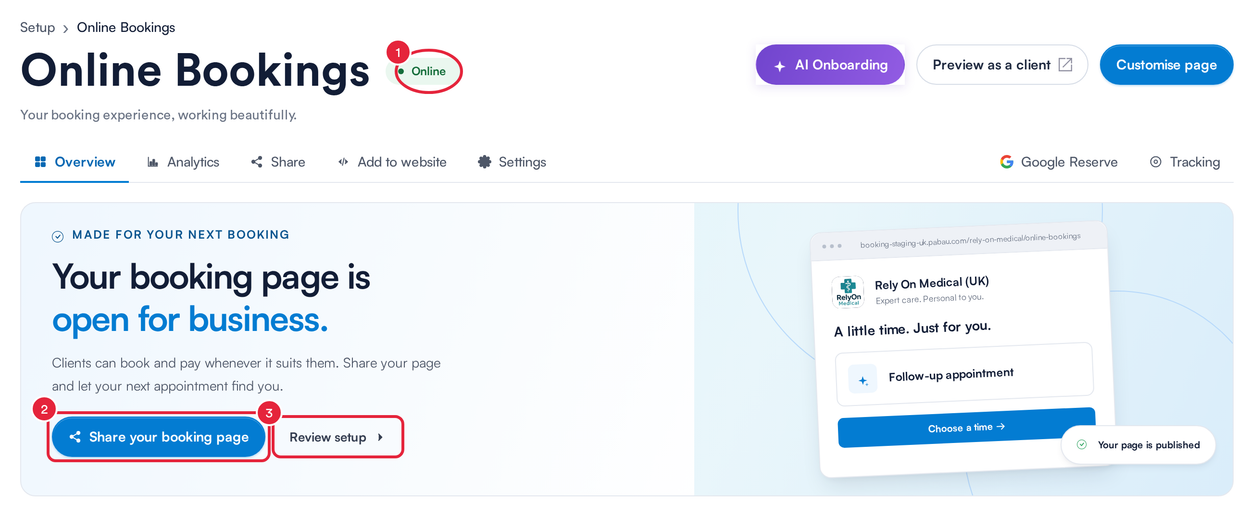
The top of the Overview tab: your page status and next step
Step 2: Check Booking Performance
Under Performance at a glance:
- Choose the period: Today, 7 days, 30 days or Quarter.
- Choose a location, or leave All locations.
- Choose a channel (where clients came from), or leave All channels.
- In Booking performance, switch between Revenue and Bookings. The figure is compared with the previous period of the same length.
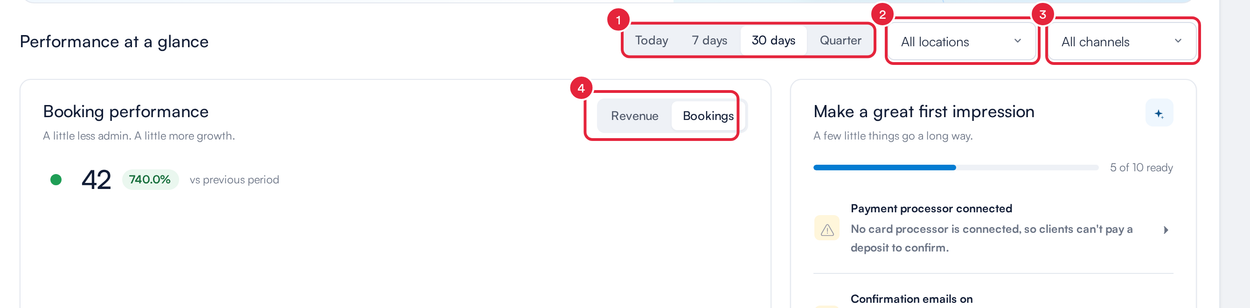
Performance at a glance, with the period, location and channel filters
NOTE: Your filters are kept in the page address, so if you bookmark or share the page it opens on the same period, location and channel.
Step 3: Work Through the Readiness Checklist
The Make a great first impression card shows how many checks are ready (for example, 5 of 10 ready) and lists the ones that need attention, such as Payment processor connected or Providers have a photo. Click an item to go straight to the fix.
- Click View checklist to see every check.
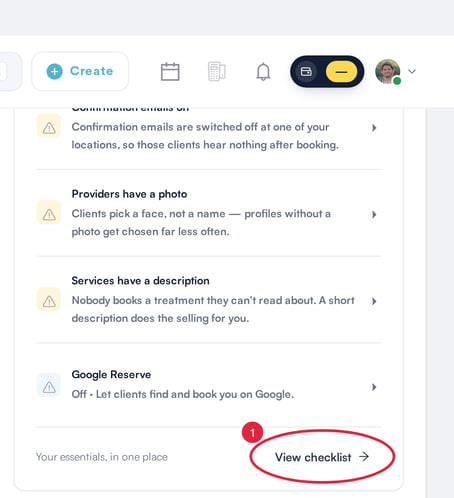
The readiness checklist on the Overview tab
What each check means, and how to fix it, is covered in Preconditions for Seamless Functionality in Your Online Bookings.
Step 4: See Where Clients Drop Out and Where Bookings Come From
From first click to confirmed shows the share of clients who start a booking and go on to confirm it, drawn as a funnel of the stages they reach, in this order: Service selected, Provider selected, Slot selected, Payment started, Details entered and Confirmed. Provider selected only appears if your booking page asks clients to choose a provider. Between each stage you can see the drop and how many clients were lost, and the largest one is marked Biggest drop.
Next to the percentage, a rating compares it with other clinics: Below average (under 8%), Average (8–15%), Good (15–22%) or Excellent (22% and over). Click the i icon to see how the rating works.
Search engines, social apps and other bots open your booking page without ever booking. Hide crawler traffic, at the top of the card, is on by default and leaves them out: carts opened by a visitor that says it is a bot, and bursts where almost no one picks a time and the carts look automated. Anyone who picked a time is always counted. The switch applies to the whole dashboard, and the rating only shows while it is on.
- To see every start, including crawler traffic, switch Hide crawler traffic off. A note under the funnel says how many starts look like crawler traffic.

Hide crawler traffic is on by default
Where bookings come from splits your bookings by where clients came from — your website, Google, social media, QR codes, links you share and so on.
At the foot of the card, Deep Analysis explains why clients don’t finish booking and what to change (see Get Advice With Deep Analysis below).
- Click Explore analytics to open the Analytics tab (Step 6).
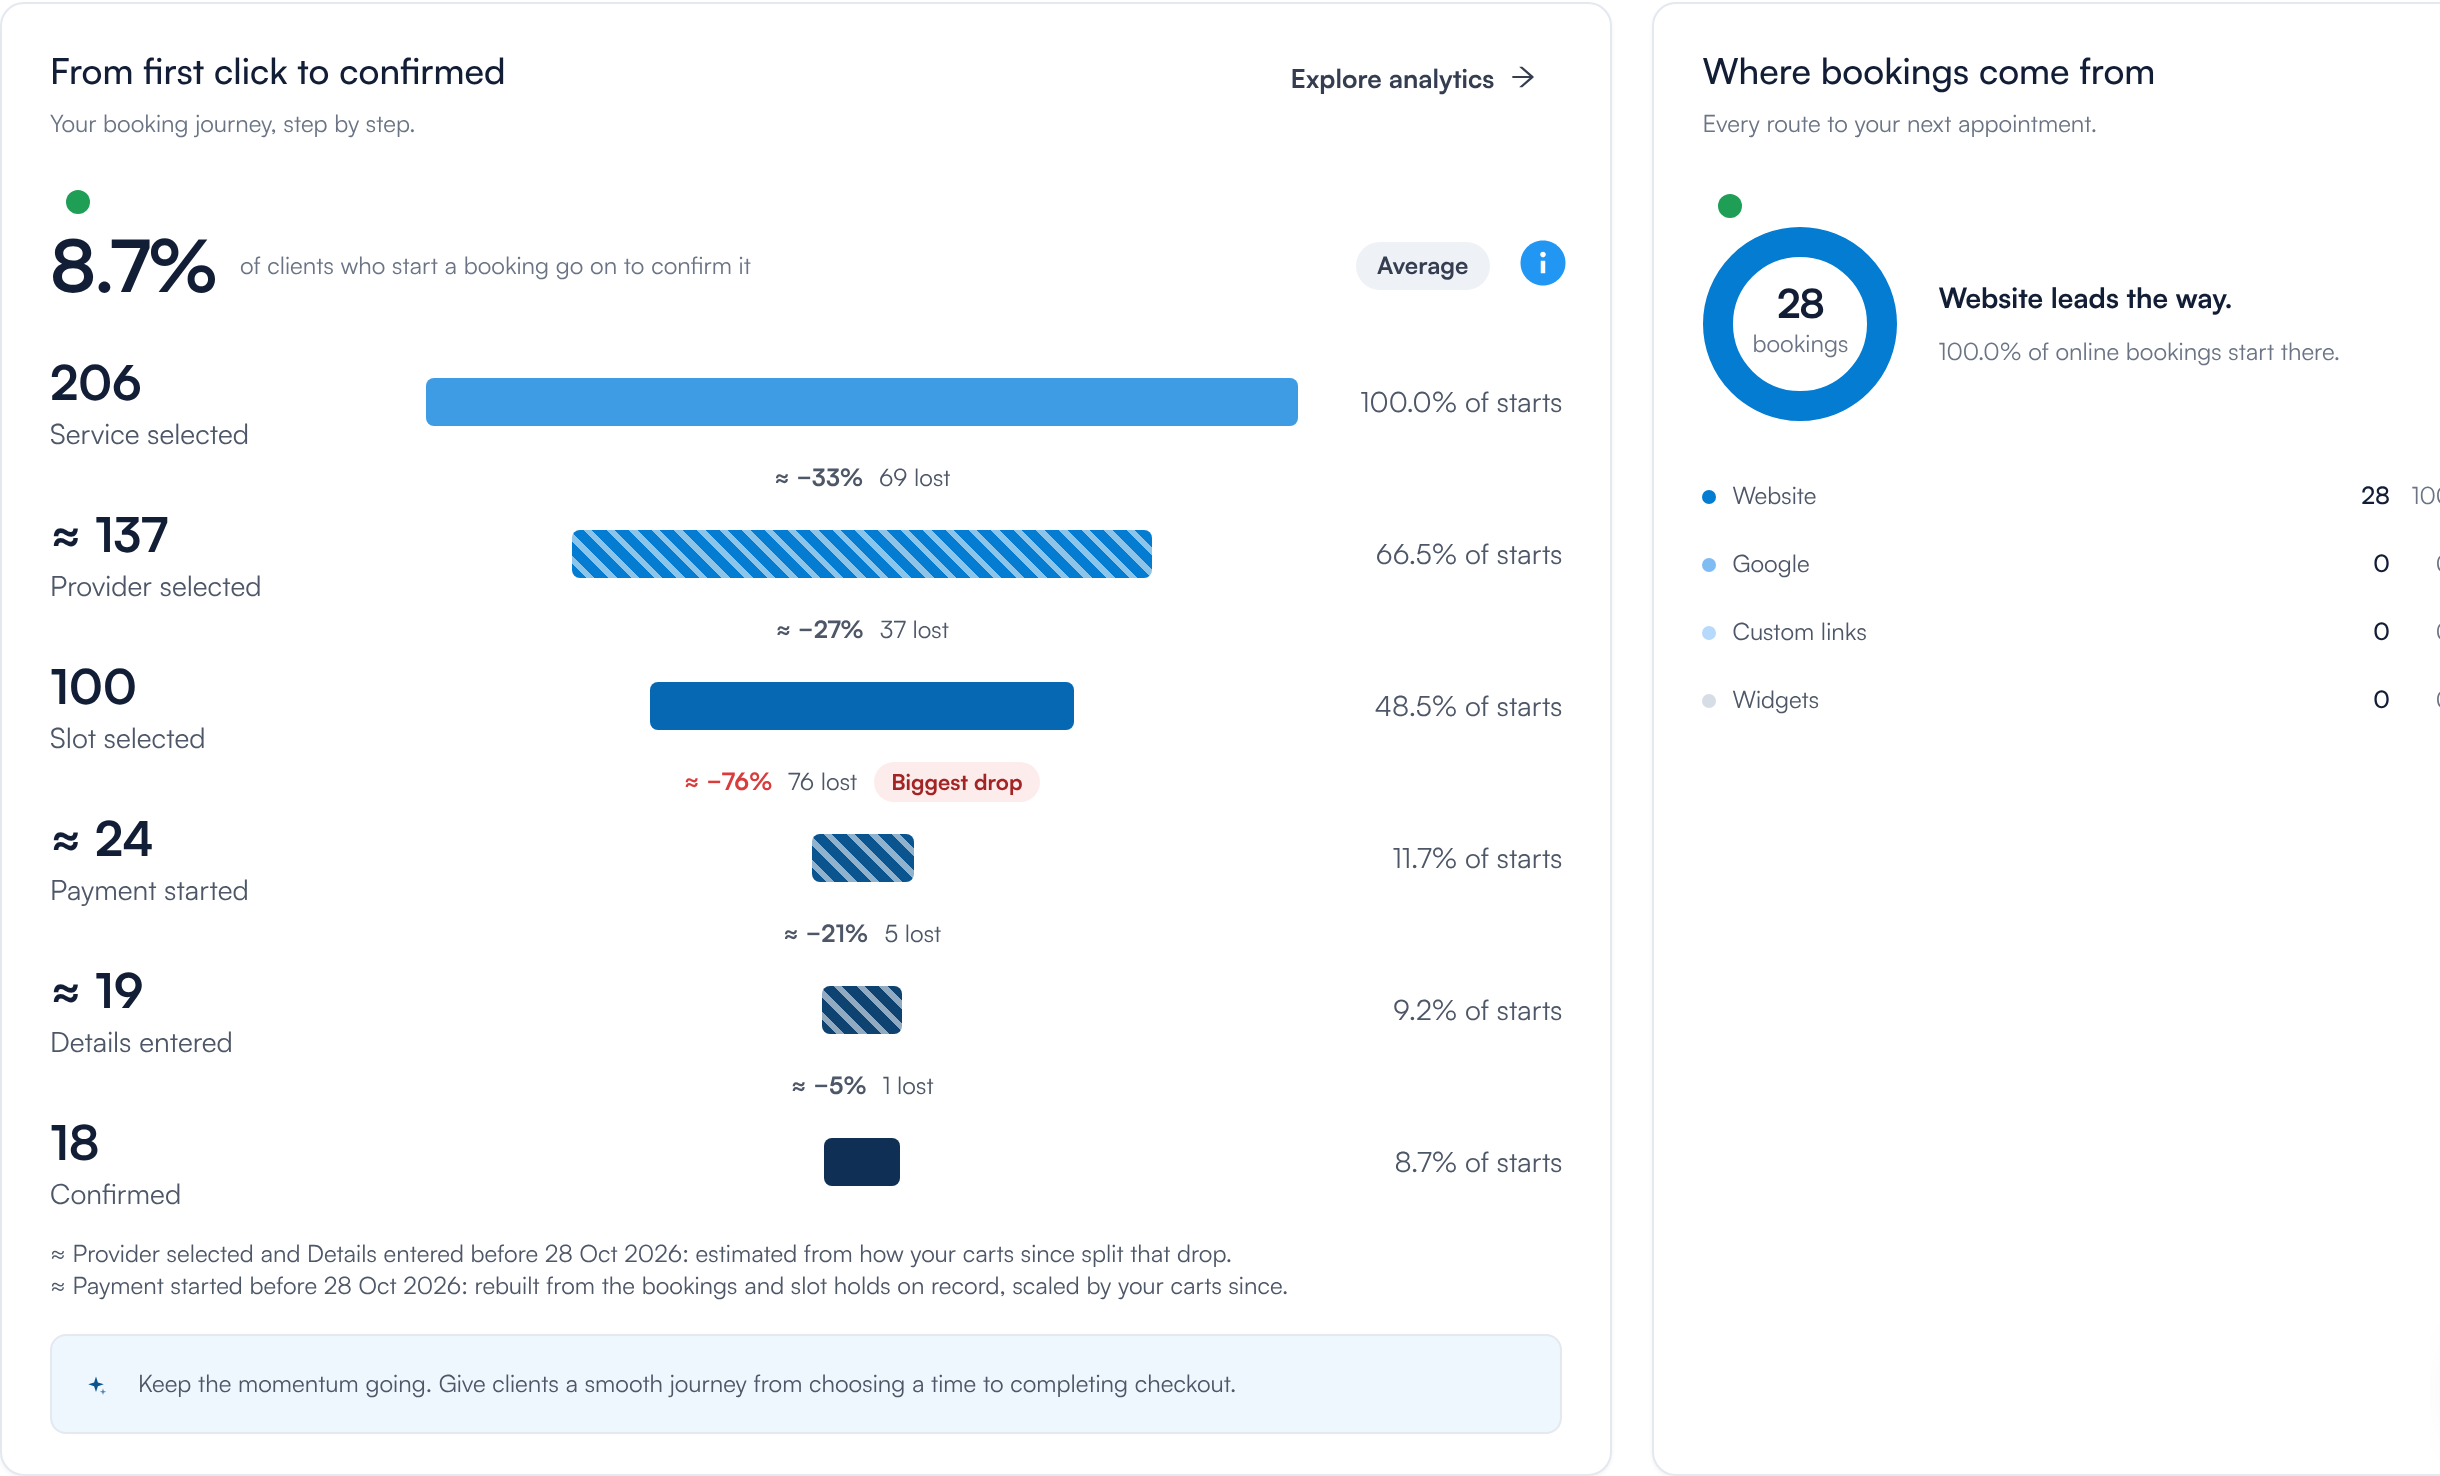
The booking funnel, its rating, and the channels your bookings came from
NOTE: Some stages are only measured from a recent date: Payment started and Details entered from 28 October 2026, and Provider selected from the first time a client chose a provider on your page. For a period that starts earlier, Pabau estimates the missing part from your more recent bookings: the band is hatched, the count reads with a ≈ sign (for example ≈ 137), and a note under the funnel says how it was estimated. While Hide crawler traffic is on, a note under the funnel says how many starts from crawlers were left out.
TIP: Bookings from links you create on the Share tab are tagged with that link, so you can see which campaign or social network brought each client in. See How to Create a Custom Link for Online Bookings.
Step 5: Follow Your Latest Online Bookings
Booking activity lists your online bookings with the client, appointment, source, status, when it is scheduled for and when it was booked.
For a booking made through a booking widget on your website, the line under the source names the widget and the page it was on, for example Floating button · /hydrafacial/. The widget can be Floating button, Popup button, Embedded on page, Link button or WordPress plugin. Bookings made through the WordPress plugin count under Widgets.
- Filter by source with All sources.
- Filter by status with All statuses.
- Search for a client, service or link.
- Click Refresh to load bookings made since you opened the page.
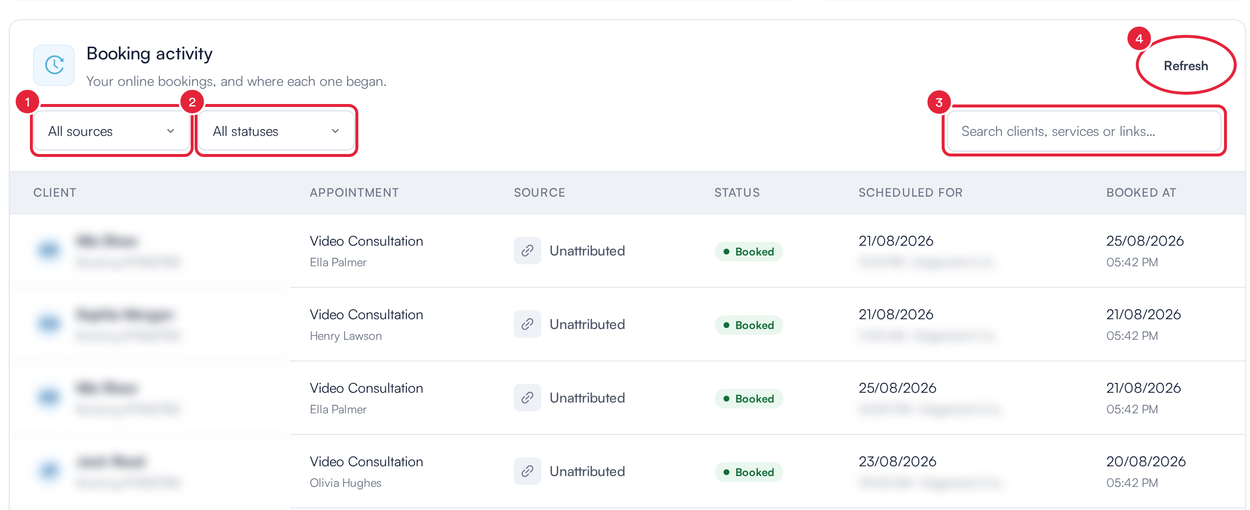
Booking activity: your recent online bookings and where each one began
Step 6: Go Deeper on the Analytics Tab
- Open the Analytics tab. It shows tiles such as Bookings confirmed, Revenue booked, Completion rate, the Checkout funnel and its biggest drop, performance by location, deposits collected, revenue by channel, and the days and times clients want to be seen.
- Click Add tiles to add more, such as Average booking value, No-show rate or Online vs front desk.
- Click Edit to rearrange or remove tiles.
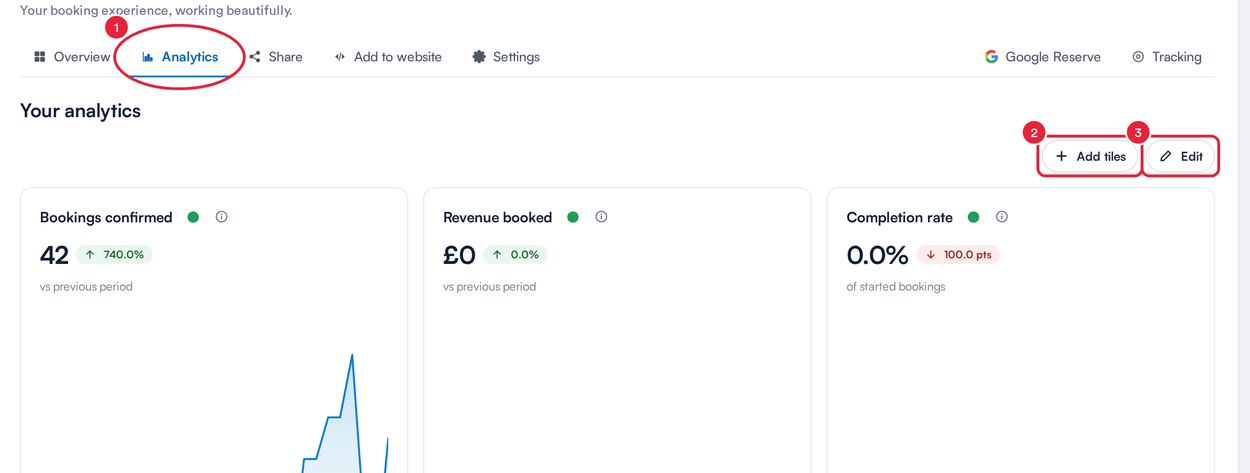
The Analytics tab, with Add tiles and Edit
Get Advice With Deep Analysis
Deep Analysis reads your online booking data and picks out the few changes most likely to win you more bookings. It looks at the last 30 days (where clients stop, your diary, deposits and sign-up settings) and compares you with clinics like yours and with every clinic on Pabau.
- On the Overview tab, scroll to the foot of From first click to confirmed and click Run Deep Analysis.
- A progress screen shows each stage: Getting started, Reading your bookings, Comparing you with clinics like yours and Writing your analysis. This usually takes about a minute. You can close the window; the analysis carries on and the result is saved on the card. To check on it, click View progress.
- When it is ready, the card shows the headline. Click Open analysis to read the report.

Deep Analysis at the foot of the From first click to confirmed card
The report starts with How you compare, a table of your figures against similar clinics and All Pabau clinics, such as Clients who pick a time, Online no-shows and Required sign-up details. Below it, What to change, most important first lists the advice, each with What to do:, followed by Worth a follow-up and Working well.
The analysis never sees client names. Where it mentions a client, it shows their ID: click Open client # and the number to open the client’s card in a side drawer, and close the drawer to return to the analysis. To run a fresh analysis, click Regenerate.
NOTE: Your clinic can run up to 10 analyses in 24 hours. Deep Analysis covers every branch, so it only appears for users who have access to all of your clinic’s branches. An analysis is kept for 90 days.
What’s next?
How Do I See My Booking Page as a Client Sees It?
On the Online Bookings dashboard, click Preview as a client (next to Customise page, top right). Your live booking page opens in a new tab, exactly as clients see it — click through a booking to check the services, providers and times. The same link is on the Share tab.
NOTE: Preview as a client shows your published page. To see changes you have not published yet, open Customise page and switch to Interact (the arrow next to Edit) to click through the page as a client would; use Desktop and Mobile to check both layouts. After you click Publish, View live site opens the live page.
Where this comes from: the classic Setup preview no longer applies in the new Online Bookings — the preview now lives on the dashboard and in Pabau Studio.
Fix anything the checklist flags in New Online Bookings Part 1: Get Your Booking Page Ready, then design your page in Part 2: Customise and Publish Your Booking Page in Pabau Studio. For a map of everything in Online Bookings, see Online Bookings: An Overview of the New Booking Page.
Questions? Reach us any time via the in-app chat — we’re happy to help.
Was this guide helpful? Let us know by voting below - your feedback helps us write clearer articles.
For more guides, browse the related articles below or use the search bar at the top of the page. You can also watch our video learning series, the Pabau Academy, or visit the Support page for additional help.