
Table of Contents:
1. How to Create a Custom Report
2. How to Edit Custom Reports
3. How to Delete Custom Reports
4. How to Share Custom Reports
5. Organizing and Managing Custom Reports
NOTE: Access to reports is controlled by two staff permissions: "Can access reports page" (required to open Analytics > Reports at all) and "Can create custom reports" (required to build new custom reports - without it, the "Build a custom report" button is disabled). An admin can adjust these in each staff member’s permissions.
How to Create a Custom Report from Scratch
Step 1: Navigate to Analytics
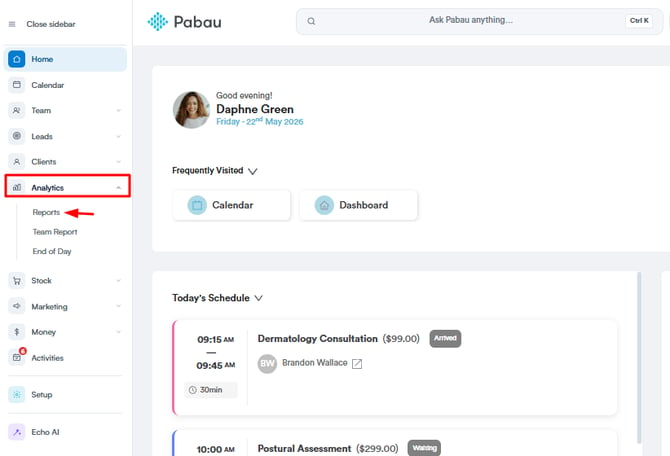
Log in to your Pabau account, and in the left sidebar menu, go to Analytics, then click on the "Reports" button. If you land on the legacy Reports page, click Try it now on the "Try our new suite of reports" banner to open the new reports experience.
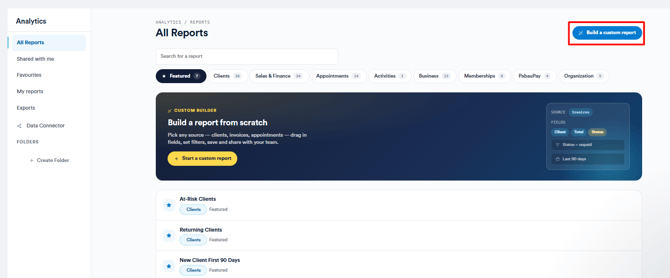
In the top right corner of the new reports view, click the "Build a custom report" button (marked with a magic-wand icon) to start the report creation process. On the Featured tab you can also use the "Custom builder" card and click "Start a custom report" - both open the same builder.
Step 2: Select a Data Object
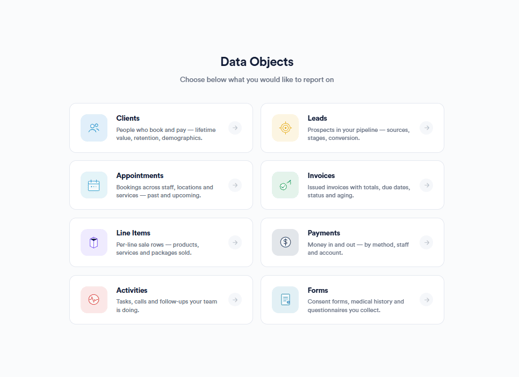
A full-screen "Data Objects" picker opens, asking you to choose what you would like to report on: Clients, Leads, Appointments, Invoices, Line Items, Payments, Activities, or Forms. These are the data sets your report will focus on - carefully select the one that aligns with your reporting needs. (Choosing Forms takes you to the Forms reporting screen instead of the builder.)
Step 3: Choose Report Starting Point
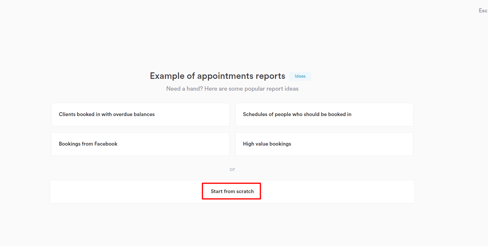
After selecting the Data object, you have two options to proceed. You can either click on one of the provided report ideas, tailored to common analytics scenarios, or opt to start from scratch by clicking the "Start from scratch" button.
Choosing the latter option allows you complete freedom in designing a report that precisely matches your requirements.
Step 4: Name and Describe the Report
At the top of the builder, click the report name to edit it - a report name is required before you can save. You can also add an optional description so colleagues understand what the report shows, and file the report into a folder using the folder dropdown ("No folder" by default).
Step 5: Add and Arrange Fields (Columns)
The columns displayed in the report are managed in the "Fields" sidebar on the left side of the builder. Use the search dropdown to find and add fields - including your custom fields - then drag and drop them to reorder the columns, or set a field to sort ascending or descending. Remove a field to take its column out of the report.
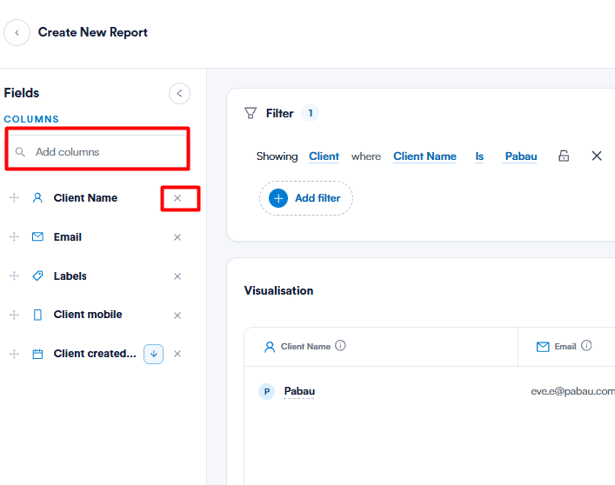
Step 6: Add, Edit, Delete, and Lock Filters
To add a filter condition, click the plus sign below the existing condition, and fill in the new filter details.
To edit a filter, find the condition you want to edit, click on the element you wish to change, and select a different option from the dropdown menu.
To delete a filter, hover over the condition you want to remove and click the "X" sign.
To lock a filter so it can’t be changed by anyone viewing the report, click the padlock icon next to the condition. Click the padlock again to unlock it. Locked filters are saved as part of the report. (On date-based filters, the date value itself stays adjustable even when locked - the lock freezes the field and operator.)
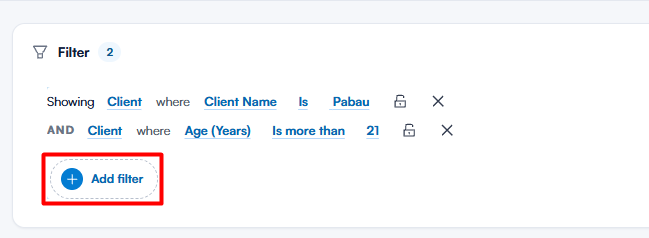
Each filter has four elements - object, field, operator, and value.
In the screenshot below, you can see an example of the four elements in the "Appointments by Location" report.
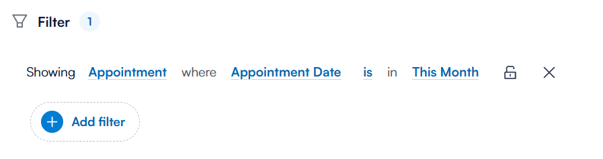
- Object: This is what you’re focusing on ("Appointment").
- Field: This is the specific detail you’re interested in ("Appointment date").
- Operator: This shows how the field relates to the value ("is").
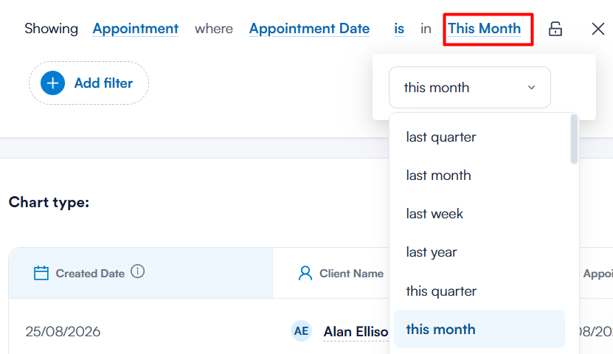
- Value: This is the specific data you’re looking at ("this month").
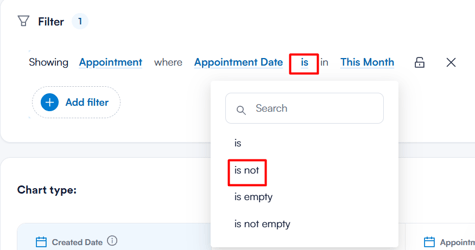
Each of these elements can be customized by clicking on them and choosing a different option.
For example, if you want to view all appointments except those scheduled for this month, you can change the operator to "is not" to exclude them.
If you want to see all appointments for a specific location during a different time frame, such as last month, last quarter, or any other period, click on the current value (e.g., "this month"). You’ll then be able to choose from a list of available options to set your desired time frame.
You can also select “Last” and then choose “Custom.” This will display a field where you can enter the number of days (e.g. “2” for the last 2 days). The report will include appointments from that many days before today.
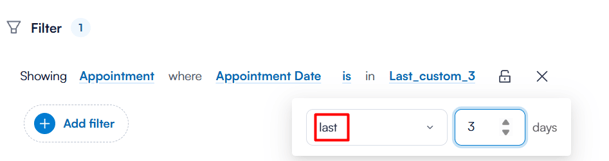
These examples show just a few options. The system has many filters you can mix and match to create detailed, customized reports.
NOTE: All of the changes made to the filters are reflected automatically in the report data in the lower section of the screen - there is no "Run" button to press, and no manual refresh is needed.
Step 7: Use Data Visualization Tools
In the Type section of the builder you can choose how the report data is visualized: Table, Pie, Donut, Bar, Line, or Number. For chart types you can also configure Segment by, Measure by, and View by dropdowns to control how the data is grouped, counted, and broken down over time, and open "Chart settings" to adjust the label color and font size.
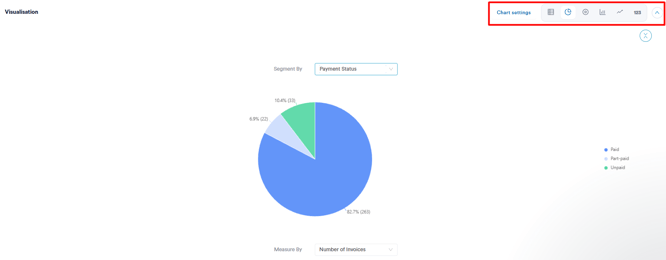
NOTE: The Bar and Line chart types, "Chart settings", and report folders are part of the Insights Plus add-on. If your account doesn’t have Insights Plus active, selecting them takes you to the Insights Plus page under Setup > Subscription, where you can learn more and activate it.
Step 8: Manage Access
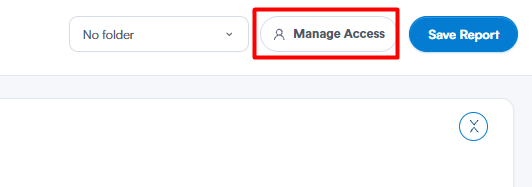
Custom reports are private to you by default. To change who can see or edit a report, open the Manage access panel - either from the access button in the report builder’s header, or by clicking the three-dot menu next to the report in the list and selecting "Manage access". You can choose between:
- Private to the creator - only you can open the report.
- Everyone can access - all employees in your account.
- Specific users or teams - choose exactly who, and what they can do. Each person can be set to Hidden (cannot see the report), View only (can open, not change), or View & edit (can open and change).
Step 9: Save the Report
Once you’ve set everything up, click the "Save Report" button in the top right corner of the builder. Your new custom report is saved and listed under "My reports" in the reports sidebar. If you try to leave the builder without saving, a confirmation appears - choose "Leave without saving" to discard the report or stay to keep working.
NOTE: You can also learn about this topic by watching a lesson on Pabau Academy. For a focused walkthrough, see How to Create a Custom Report from Scratch.
How to Edit a Custom Report
Editing a saved custom report enables you to refine and update the report parameters, ensuring it remains relevant to evolving analytical requirements. There are two ways to make changes: Customize (edits the original report in the builder) and Save as from the report viewer (saves your changes as a new copy, leaving the original untouched).
Step 1: Navigate to Analytics
Log in to your Pabau account, and in the left sidebar menu, go to Analytics, then click on the "Reports" button. If you land on the legacy Reports page, click Try it now on the "Try our new suite of reports" banner.
Step 2: Open the Report for Editing
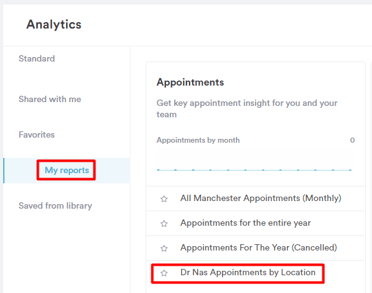
In the reports sidebar, click "My reports" to see your saved custom reports. Hover over the report you want to edit, click the three-dot menu at the end of its row, and select "Customize". This opens the report in the full builder, pre-loaded with its current fields, filters, and chart setup.
There is no "Edit" button inside the report view itself - opening a report by clicking its name shows the viewer, where any changes you make can only be saved as a new copy via "Save as".
Step 3: Adjust Filters
In the builder, you can modify the existing filters applied to the report. Filters help refine the data included in the report, allowing you to focus on specific criteria.
To add a filter condition, click the plus sign below the existing condition, and fill in the new filter details.
To edit a filter, find the condition you want to edit, click on the element you wish to change, and select a different option from the dropdown menu.
To delete a filter, hover over the condition you want to remove and click the "X" sign.
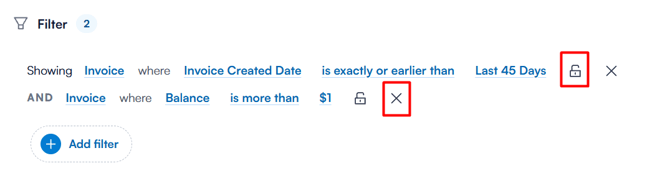
To lock a filter so it can’t be changed by anyone viewing the report, click the padlock icon next to the condition. Click the padlock again to unlock it. Locked filters are saved as part of the report. (On date-based filters, the date value itself stays adjustable even when locked - the lock freezes the field and operator.)
Each filter has four elements - object, field, operator, and value.
In the screenshot below, you can see an example of the four elements in the "Appointments by Location" report.
.webp?width=603&height=238&name=image-png-Dec-13-2023-02-55-40-6828-PM-Jan-26-2024-10-49-09-4279-AM%20(5).webp)
- Object: This is what you’re focusing on ("Appointment").
- Field: This is the specific detail you’re interested in ("Appointment date").
- Operator: This shows how the field relates to the value ("is").
- Value: This is the specific data you’re looking at ("this month").
Each of these elements can be customized by clicking on them and choosing a different option.
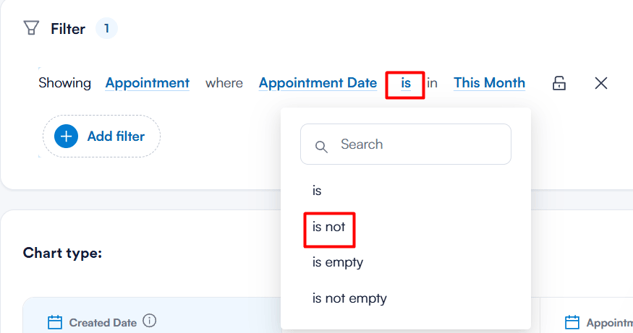
For example, if you want to view all appointments except those scheduled for this month, you can change the operator to "is not" to exclude them.
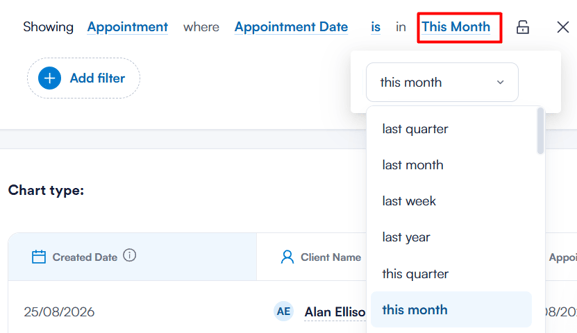
If you want to see all appointments for a specific location during a different time frame, such as last month, last quarter, or any other period, click on the current value (e.g., "this month"). You’ll then be able to choose from a list of available options to set your desired time frame.
These examples show just a few options. The system has many filters you can mix and match to create detailed, customized reports.
NOTE: All of the changes made to the filters are reflected automatically in the report data in the lower section of the screen - there is no "Run" button to press, and no manual refresh is needed.
Step 4: Change Report Name and Modify Displayed Columns
If you wish to change the report name, simply click on the name field at the top of the builder. This action will activate the text box, allowing you to edit and update the report name as needed. You can update the description in the same place.
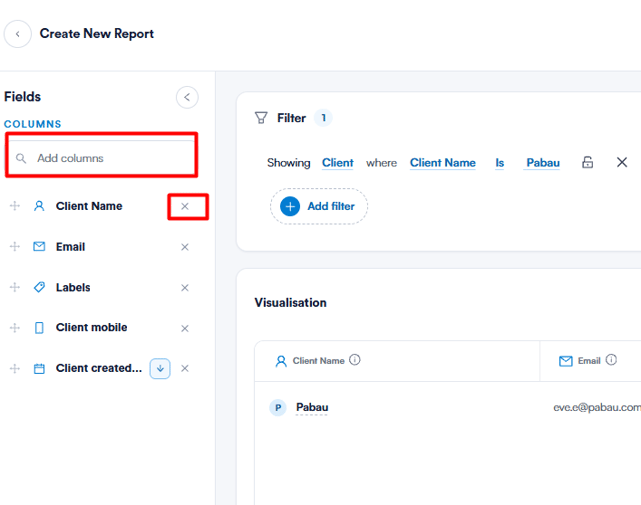
You can also modify the columns displayed in the report using the "Fields" sidebar on the left side of the screen - search to add fields (including custom fields), drag and drop to reorder them, or remove fields you no longer need.
Step 5: Manage Access
Custom reports are private to you by default. To change who can see or edit a report, open the Manage access panel - either from the access button in the report builder’s header, or by clicking the three-dot menu next to the report in the list and selecting "Manage access". You can choose between:
- Private to the creator - only you can open the report.
- Everyone can access - all employees in your account.
- Specific users or teams - choose exactly who, and what they can do. Each person can be set to Hidden (cannot see the report), View only (can open, not change), or View & edit (can open and change).
Step 6: Save Changes
Once you’ve made the necessary edits, click the "Save Report" button in the top right corner. This updates the original report with your modifications.
NOTE: Only the report’s owner - or users granted View & edit access - can save changes to a report; without edit access the Save button is disabled. Users without edit access can still choose "Duplicate" from the three-dot menu to work on their own copy.
NOTE: You can also learn about this topic by watching a lesson on Pabau Academy. For a focused walkthrough, see How to Edit a Custom Report.
How to Delete a Custom Report
Deleting a custom report is a straightforward process that allows users to remove unnecessary or outdated reports, decluttering the analytics workspace. This section will guide you through the step-by-step process of deleting a custom report.
Step 1: Navigate to Analytics
Log in to your Pabau account, and in the left sidebar menu, go to Analytics, then click on the "Reports" button. If you land on the legacy Reports page, click Try it now on the "Try our new suite of reports" banner.
Step 2: Open the Saved Custom Reports
Within the reports view, click "My reports" in the sidebar on the left side of the screen to access a list of your saved custom reports, and identify the specific report you want to delete.
Step 3: Delete the Report
Hover over the report you want to delete and click the three-dot menu that appears at the end of the row, then select "Delete" from the dropdown menu.
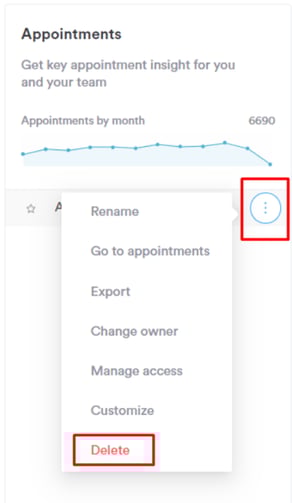
After selecting "Delete," the system will ask you to confirm the deletion - deleting a report cannot be undone, so confirm only when you are sure. You can also delete an open report from the viewer via the More options (three-dot) menu in the top right.
NOTE: Only the report’s owner can delete it. If you don’t see "Delete" in the menu, the report belongs to someone else - you can still duplicate it or ask the owner to transfer ownership.
NOTE: You can also learn about this topic by watching a lesson on Pabau Academy.
How to Share Custom Reports
There are two ways to share a custom report: granting colleagues access inside Pabau with Manage access (the primary sharing mechanism), or generating a public link that can be opened by anyone - even without a Pabau account.
Step 1: Navigate to Analytics
Log in to your Pabau account, and in the left sidebar menu, go to Analytics, then click on the "Reports" button. If you land on the legacy Reports page, click Try it now on the "Try our new suite of reports" banner.
Step 2: Share with Colleagues via Manage Access
In "My reports", hover over the report, click the three-dot menu, and select "Manage access". Choose Private to the creator, Everyone can access, or Specific users or teams - with each individual set to Hidden, View only, or View & edit. Reports shared with a colleague appear in their "Shared with me" section.
Step 3: Share a Public Link
To share a report with someone outside Pabau, open the report and click the Share icon button in the top right corner of the viewer. This generates a link to the report that can be shared with anyone.
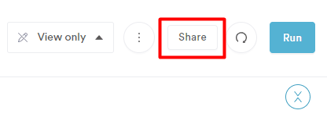
This link allows recipients to open and view the report without needing to log into Pabau.
NOTE: You can also learn about this topic by watching a lesson on Pabau Academy.
Organizing and Managing Custom Reports
Beyond creating and editing, the new reports experience gives you several tools for keeping your custom reports organized:
- Folders - create folders (and subfolders) from the reports sidebar to group related reports, and rename or delete them from the same place. You can assign a report to a folder while building or editing it. Folders are part of the Insights Plus add-on.
- Favourites - mark any report as a favourite to pin it to your "Favourites" section. See How to Favorite a Report.
- Duplicate - the three-dot menu’s "Duplicate" option creates your own copy of any report you can see, which is also the way to build on a report you don’t have edit rights to. In the open report viewer the same action is called "Clone".
- Rename - owners can rename a report inline from the three-dot menu without opening the builder.
- Change ownership - owners can transfer a report to another staff member from the three-dot menu (for example, before someone leaves the team).
- Export - from the open report’s More options menu, choose Export and pick Excel (xlsx), CSV, or PDF. Exports are processed in the background, and you can track and download them from the Exports page.
- Print - the same More options menu offers "Print report (Snapshot)" for a quick printable view.
To save a customized version of one of Pabau’s pre-built reports as your own custom report, see How to Save a Standard Report as a Custom Report.
What's next?To get your bearings on the Reports page itself - the sidebar sections, the category tabs and what the badges mean - see A Tour of the Reports Page. For every control in the builder explained in one place, including the filter operators and chart types, see the Report Builder screen reference. And to choose your columns with confidence, the report fields reference lists every field and what it shows.
For more guides, refer to related articles below, select additional guides, or use the search bar at the top of the page. These guides will help you get the most out of your Pabau account.
Additionally, to help you fully utilize and understand your Pabau account, we recommend exploring additional guides and resources offered at the Pabau Academy. It offers in-depth video tutorials and lessons, offering a holistic learning experience that can equip you with the essential skills for achieving success with Pabau.