
The Room Utilization report shows how hard each of your treatment rooms is working. For the period you choose, it compares the time each room was booked against the time it was available, so you can see at a glance which rooms are running at capacity and which are sitting idle.
It's a planning tool useful for deciding whether you need more rooms, whether a room could be repurposed, or whether bookings should be spread more evenly across sites.
How to find it
Step 1: Navigate to the Analytics Feature
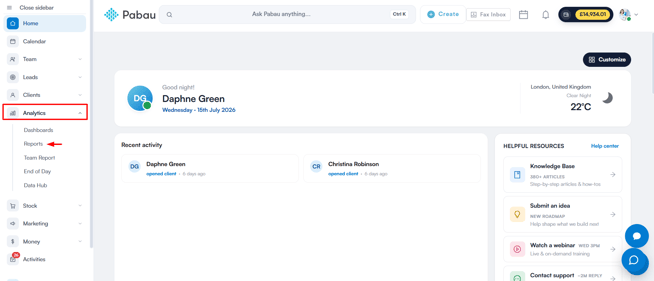
Log in to your Pabau account, and in the left sidebar menu, go to Analytics, then click on the "Reports" button.
Step 2: Access the reports banner
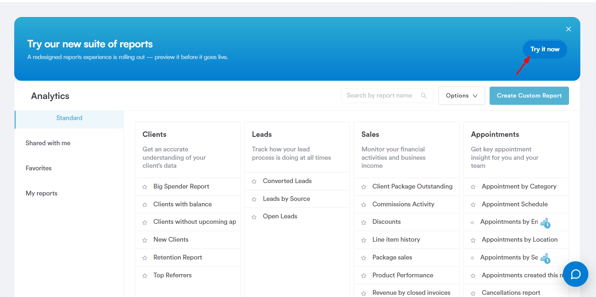
On the "Try our new suite of reports" banner, click Try it now.
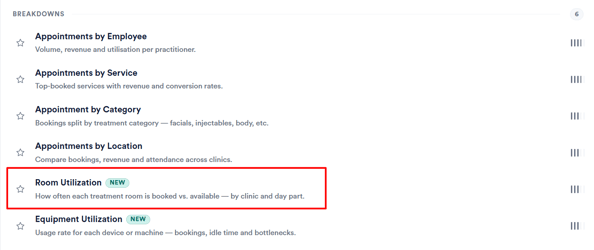
Once you're in the new reports view, go to the Appointments section then scroll to the "Breakdowns" group and click on Room Utilisation to open the report.
Before you read the numbers - where the data comes from
The report doesn't have settings of its own for rooms, hours, or capacity - it pulls everything from your existing Setup, so its accuracy depends entirely on how these areas are configured. Most "the numbers look wrong" questions trace back to one of these:
1. Your rooms — Setup → Rooms
Every active room linked to the location appears as a row in the report. If a room is missing, check that it exists here and is active — deleted or deactivated rooms are deliberately left out. A room's name in this report is exactly its name in Setup → Rooms.
2. Each room's capacity (its "slots")
A room can be set up to hold more than one appointment at the same time. This concurrent capacity is what the report calls the room's slots, and it directly affects both the available time and how overlapping appointments are counted. Most rooms hold one appointment at a time, so for them this is simply 1 — though 2 or more appointments can be fully or partially overlapped in rooms with higher capacity.
3. Your opening hours — Setup → Locations → (the location) → Opening Hours
This is where the "available time" comes from, and it's the part most people overlook. Each location has its own Opening Hours tab listing the open and close time for every day of the week, with the option to mark a day closed. The report uses these hours to work out how long each room could have been used:
- When you filter to a specific location, that location's Opening Hours are used.
- When you're viewing All locations, the company default opening hours are used — unless your account has access to just one active location, in which case that location's own hours are used, so the figure matches what you'd see selecting it directly.
- For any day a location hasn't set, the report falls back to your company default opening hours.
- If no opening hours are configured anywhere, the report assumes 10 hours per day so the percentages can still be calculated — but this is a safety net, not a real figure.
Days marked closed count as zero available time, so they correctly don't drag your utilisation down.
4. Your location permissions
You'll only ever see rooms, bookings, and hours for the locations your user account is allowed to access — even the "All locations" view never shows data from a site you don't have permission for.
Toolbar controls
| Button | What it does |
|---|---|
| Columns | Choose which of the four table columns are shown (Room, Bookings, Hours booked, Utilisation). Untick any column to hide it, or Reset to default to bring them all back. Your selection is remembered next time. |
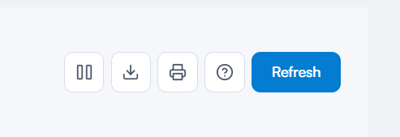
| Export | Downloads the per-room breakdown as a CSV file, containing exactly the columns currently shown for the dates and location selected. The summary totals aren't included — the file holds the per-room rows only. |
| Opens your browser's print dialog with a clean, print-friendly layout, including a summary of the filters applied. | |
| Help | Opens a short in-app explanation of the report and its columns. |
| Refresh | Re-runs the report with your current filters to pull the latest bookings. |
Filters
- Dates – Required. The period the report covers, defaulting to Today. Every figure on the page is built only from appointments starting within these dates, and available time is calculated across this same range — so a longer range means more available hours to fill.
- Location – Defaults to your primary location when one is set on your staff profile, and to All locations otherwise. Pick a single clinic site to narrow the report to that site's rooms and opening hours.

Understanding the report
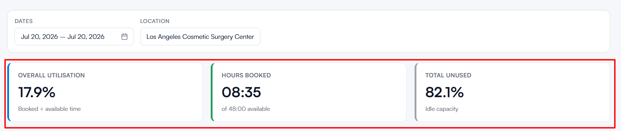
The summary cards
- Overall utilisation – Total booked time as a percentage of total available time across all rooms. Your single "how busy were we overall" number.
- Hours booked – The total time booked across all rooms in the period, shown as hours:minutes, with the total available time shown alongside (e.g. "of 420:00 available").
- Total unused – Your idle capacity — the share of available time that went unbooked. It's the mirror image of Overall utilisation, so 35% utilised reads as 65% unused.
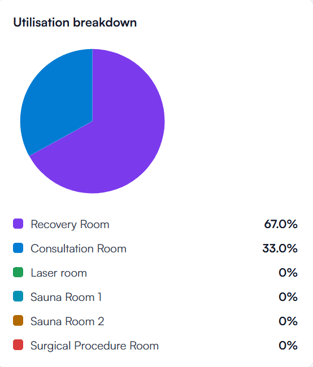
The utilisation breakdown chart
The pie chart and the list beside it show each room's share of the total booked time, ordered busiest-first. The slices add up to 100% across your rooms, and each room keeps the same colour in the chart, the list, and the table, so they're easy to match up. This is the quickest way to see whether your bookings are concentrated in a couple of rooms or spread evenly.
The room table
Each row is a single room, sorted from most to least utilised.
| Column | What it shows |
|---|---|
| Room | The room's name, with its colour swatch from the chart. |
| Bookings | The number of appointments held in that room during the period. |
| Hours booked | The total booked time in that room, shown as hours:minutes. |
| Utilisation | That room's booked time as a share of its own available time. 100% means the room was fully booked across the location's open hours. |
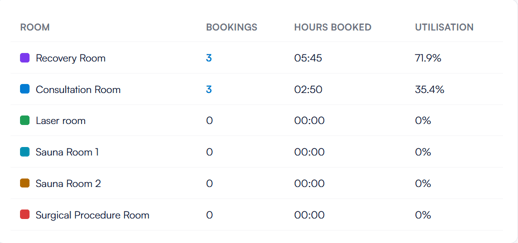
NOTE: The Bookings number is clickable. Clicking a room's booking count opens the Appointments report in a new tab, pre-filtered to exactly those appointments - same room, same dates, same location scope, with cancelled and no-show appointments excluded so the count always reconciles with the appointments behind it.
If nothing matches your filters, you'll see: "No rooms match your filters for this period and location."
How the figures are calculated
Available time for a room = its slots (concurrent capacity) × the open hours for each day in the period. Open hours come from the location's Opening Hours, falling back to the company default for any unset day, and to 10 hours/day only if nothing is configured at all. Closed days contribute zero, and a 2-slot room has twice the available time of a 1-slot room, since it could hold two appointments at once.
Booked time is the actual occupied time, not a simple sum of appointment lengths — overlapping appointments are only counted up to the room's capacity. Two appointments running at the same time in a one-slot room count as a single block of occupied time, not two, so genuine double-bookings don't inflate the figure. A two-slot room legitimately counts both.
NOTE: Cancelled and no-show appointments are never counted, since the room wasn't actually used.
Worked example: a single-slot Laser Room at a site open 9:00–17:00 Monday to Friday (8 hours a day), reported over a full week, has available time of 1 slot × 8 hours × 5 open days = 40 hours (the weekend is closed, so it adds nothing). If 30 hours of appointments were held in it that week, its utilisation is 30 ÷ 40 = 75%.
NOTE: Per-room percentages don't add up to 100% because each room's Utilisation is measured against its own availability, independently of the others. The Overall utilisation card is the only pooled, clinic-wide figure.
With this understanding, you can confidently use the Room Utilisation report to see which rooms are running at capacity and which are sitting idle, so you can plan space and bookings accordingly.
Was this guide helpful? Let us know by voting below - your feedback helps us write clearer articles.
For more guides, browse the related articles below or use the search bar at the top of the page. You can also watch our video learning series, the Pabau Academy, or visit the Support page for additional help.