
The Returning Clients report tracks lapsed clients who came back.
It answers: which clients returned after a long gap, how long were they away, what brought them back, and what did they spend afterwards? It's great for measuring the results of your win-back efforts.
Each row is one return event - a lapse-then-return cycle - so a client who lapsed and returned twice appears twice.
How to find it
Step 1: Navigate to the Analytics Feature
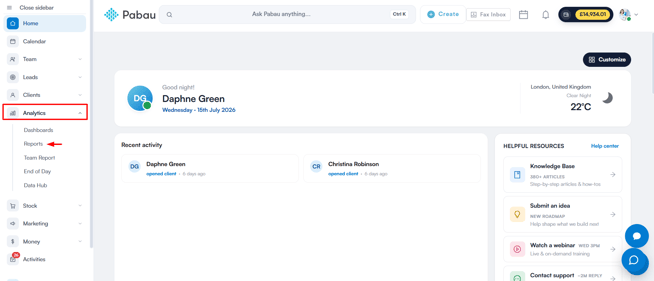
Log in to your Pabau account, and in the left sidebar menu, go to Analytics, then click on the "Reports" button.
Step 2: Access the reports banner
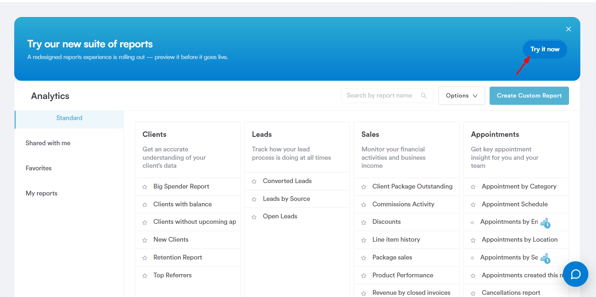
On the "Try our new suite of reports" banner, click Try it now.
Once you're in the new reports view, go to the Clients section then scroll to the "Take action today" group and click on Returning Clients to open the report.
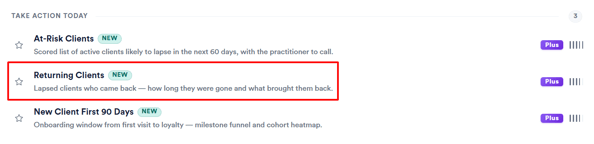
NOTE: Returning Clients carries "New" and "Plus" badges in the catalog, and also appears under the Featured tab of the reports view.
Filters
- Return Visit Date – The window the return visit must fall in. Maximum 365 days.
- Location – Exactly one location.
- Treatment Category – Filters on the returning visit's treatment. "Uncategorised" is a selectable bucket.
- Win-back Trigger – Filter to Returning-client offer, Referral from existing client, or Other / self-initiated.

Understanding the report
What counts as a "return"
A client returns when they come back for a qualifying appointment, and their previous qualifying appointment was at least 180 days earlier. A qualifying appointment is any appointment that isn't cancelled, no-show, or moved.
NOTE: The report only looks back 365 days before the window, so only gaps of roughly 180 to 540 days can be detected. Clients who were away longer than around 18 months won't be picked up.
The KPIs
- Returning clients – distinct clients who returned in the window. A client counts once here even if they returned twice.
- Win-back rate – of the clients who were lapsed-but-recoverable at the start of the window, the share who actually came back.
- Median gap – the typical gap length, in days, across all returns.
- Recovered revenue – total spend in the 90 days after returns, with each payment counted only once even if return windows overlap.
- Second-life ticket – how much more (or less) returning clients spend per visit now versus before they lapsed. 1.0 means the same, above 1.0 means spending more per visit.

Table columns
| Column | Meaning |
|---|---|
| Client | Name and ID. |
| Returned on | Date of the return visit. |
| Then → now | Their treatment before lapsing and their treatment on return, side by side, with a tag showing whether the return visit was a higher ticket, a lower ticket, or the same. |
| Gap | Days they were away. |
| Last visit was for | The treatment they had before lapsing. |
| Win-back trigger | Returning-client offer, Referral from existing client, or Other / self-initiated. |
| 90-day spend | What they spent in the 90 days after returning, with the +/-% change versus their pre-lapse per-visit spend shown underneath. |
| Booked by | The staff member who made the return booking. |
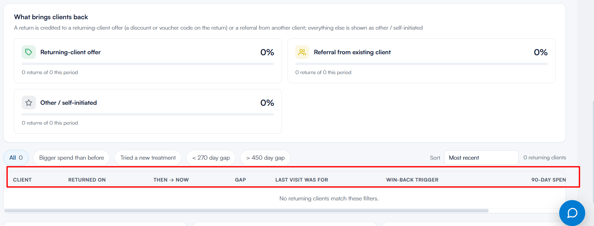
NOTE: Each return is tagged with one win-back trigger, worked out in priority order: Returning-client offer if the client had a sale with any discount applied, Referral from existing client if there's a confirmed referral for them, or Other / self-initiated if neither applies.
Working with the client list
Above the table, quick-filter chips narrow the list to All, Bigger spend than before, Tried a new treatment, < 270 day gap, or > 450 day gap. A Sort dropdown reorders the rows by Most recent, Highest 90-day spend, Shortest gap, or Longest gap, and the search box at the top of the report finds a specific client by name or ID.
To download the list, click Export in the toolbar — the report exports as a CSV file.
Charts
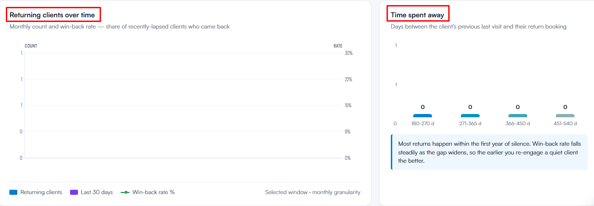
- Returning clients over time – monthly returns, with the win-back rate shown per month.
- Time spent away – a gap histogram with four buckets: 180–270, 271–365, 366–450, and 451–540 days.
- What brings clients back – the share of returns attributed to each win-back trigger.
At the bottom of the report, three insight cards recap how returns are counted and how to read the numbers — for example, comparing the "Then → now" column with the Second-Life Ticket multiplier to see how post-return spend stacks up against each client's own pre-lapse baseline.
With this understanding, you can confidently use the Returning Clients report to see how well your win-back efforts are working and what's actually bringing lapsed clients back.
Was this guide helpful? Let us know by voting below - your feedback helps us write clearer articles.
For more guides, browse the related articles below or use the search bar at the top of the page. You can also watch our video learning series, the Pabau Academy, or visit the Support page for additional help.