
The New Client – First 90 Days report is an onboarding scorecard for brand-new clients.
It answers: of the clients whose very first visit was in this period, how well did we onboard them over their first 90 days, and how many became loyal?
How to find it
Step 1: Navigate to the Analytics Feature
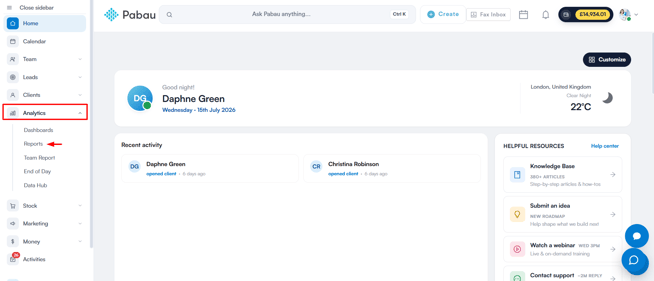
Log in to your Pabau account, and in the left sidebar menu, go to Analytics, then click on the "Reports" button.
Step 2: Access the reports banner
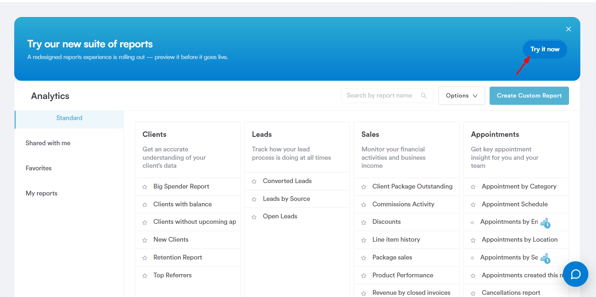
On the "Try our new suite of reports" banner, click Try it now.
Once you're in the new reports view, go to the Clients section then scroll to the "Take action today" group and click on New Client First 90 Days to open the report.
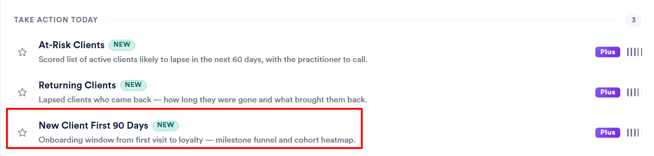
NOTE: New Client First 90 Days carries "New" and "Plus" badges in the catalog, and also appears under the Featured tab of the reports view.
Filters
- First Visit Date – The window a client's first-ever visit must fall in. Maximum 365 days (auto-trimmed if longer).
- Locations – Exactly one location.
- First Treatment – Narrow the report to clients whose first booking was a specific treatment.
- Acquisition Source – Narrow the report to a specific marketing source.

Understanding the report
Who counts as "new"
A client whose first-ever appointment across their whole history falls inside the selected window and at the selected location. A client who visited any branch years ago is not "new."
NOTE: A "visit" here is any non-cancelled appointment — no-shows and moved appointments still count, since this is about booked appointments, not confirmed attendance.
The KPIs
- New Clients – the size of the cohort.
- Activation Rate – the share who completed all four core milestones (below) within their first 60 days — each milestone by its own deadline, the last at day 60 — with a change versus the previous period.
- Time to 2nd Visit – the typical (median) number of days between a client's 1st and 2nd visit, among those who returned.
- 30-day Repeat Rate – the share of all new clients whose 2nd visit was within 30 days.
- "Loyal" by Day 90 – the share who became loyal within 90 days, with a change versus the previous period.

The five milestones
Each milestone is measured from that client's own first visit.
| Milestone | Definition |
|---|---|
| Follow-up booked (D7) | Booked another appointment within 7 days of their first visit. |
| 2nd visit (D14) | Came back for a later-day visit. |
| Treatment plan started (D30) | 3 or more appointments within 30 days. |
| Tried 2nd treatment (D60) | 2 or more different treatments within 60 days. |
| Loyal (D90) | 4+ visits or £500+ spent within 90 days. |
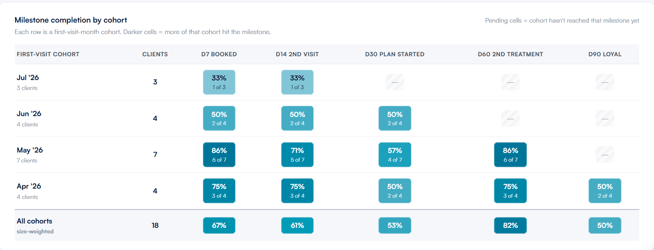
The first four are the "activation" milestones — a client is activated when they complete all four, each within its own deadline (7, 14, 30, and 60 days). Loyalty is the top outcome.
What you see
This is a dashboard, not a client list:
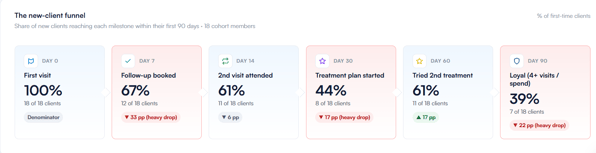
- Funnel – shows drop-off across the six stages, from first visit through to loyal.
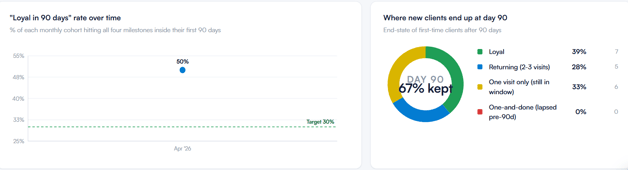
- Trend line – the % of each month's new clients who fully activated, with a 30% target line. Only months that have had a full 90 days are shown.
- End-state donut – every client lands in one of four states: Loyal, Returning (2–3 visits), One visit (still within their 90 days), or One-and-done (lapsed).
- Cohort grid – month-by-month completion rates per milestone, with cells left blank where a cohort hasn't had time to mature yet.
- Insight cards – short, automatically generated observations about your cohort, shown under the cohort grid.
NOTE: This report is a visual dashboard rather than a table, so the toolbar's Export button doesn't currently download the dashboard data — the file it produces is empty.
With this understanding, you can confidently use the New Client – First 90 Days report to see how well you're onboarding new clients and how many are turning into loyal, long-term clients.
Was this guide helpful? Let us know by voting below - your feedback helps us write clearer articles.
For more guides, browse the related articles below or use the search bar at the top of the page. You can also watch our video learning series, the Pabau Academy, or visit the Support page for additional help.