
The care pathway guides you through each step of the client visit. Once you reach the treatment step, you can open the face chart and plot injection points, each linked to a specific product, area, and dose - saved directly to the client's clinical record.
NOTE: Before getting started, make sure you're familiar with the care pathway flow.
For a full walkthrough from check-in to completion, take a look at the How to Complete the Client Pathway article.
Step 1: Launch the Pabau GO iOS App
Start by launching the Pabau GO app on your iOS device and logging into your Pabau account using your credentials.
Step 2: Open the Pathway
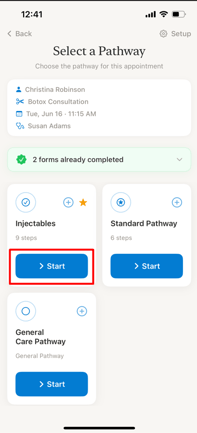
Tap Pathway from the bottom navigation bar. The Pathway screen gives you a real-time overview of all today's appointments.

Tap on the relevant client appointment, select the appropriate pathway, and tap ''Start''.
Step 3: Complete the Pathway Steps
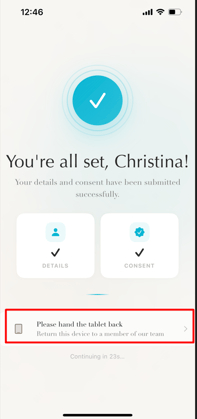
The pathway will guide you through each step of the visit. Once the client has completed check-in, medical history, consent, and photos, the Treatment step will become available for you to proceed.
NOTE: Before using the drawing or plotting tools on the app, make sure both are enabled on the form. To do this, go to Clinical > Medical Forms on the web, open the relevant form, select the chart component, and toggle on ''Enable drawing'' and ''Enable plotting'' in the right-hand panel. 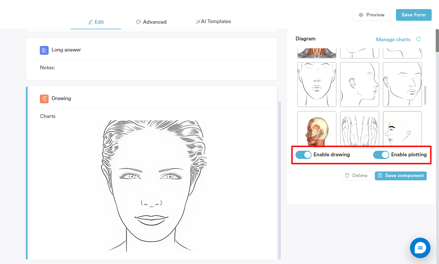
Step 4: Open the Treatment Form
Tap the Treatment step in the pathway and select the relevant treatment form. Once open, complete the required fields, then scroll down to the Charts section and tap on the face chart to open the plotting canvas.
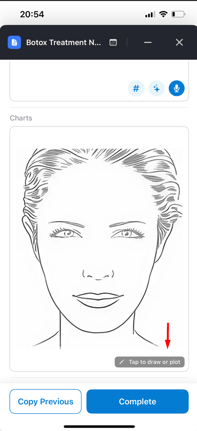
Step 5: Switch to Injection Plotting Mode
To plot injection points, tap the syringe icon in the bottom toolbar to switch from draw mode to injection plotting mode.
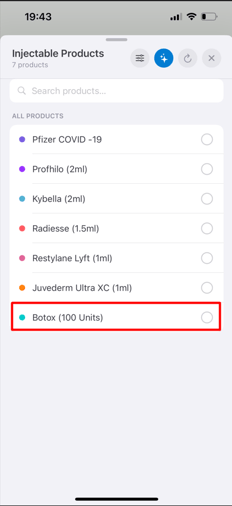
Select Your Product
Tap the product name in the bottom bar to choose which injectable you are using. Each product is automatically assigned its own colour on the chart, making it easy to distinguish between multiple products used in the same session.
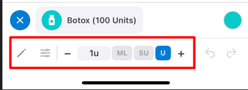
Set the Dose
Use the − and + buttons to adjust the dose per injection point, or tap the unit value directly to select from a list. You can also enter a custom value. Switch between ML (millilitres), SU (syringe units), and U (international units) using the tabs on the right.
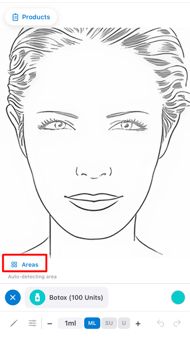
Select the Treatment Area
Tap Areas to open the area panel and choose a specific face area such as Forehead, Glabella, or Crow's Feet.
If you leave it on Autodetect, the app will automatically identify the area based on where you tap on the chart. You can also tap Visualize to see the treatment zones mapped on the chart.
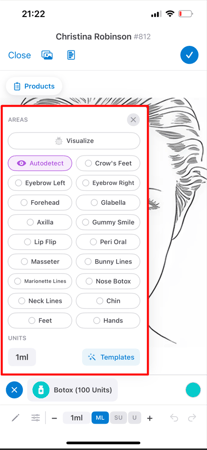
If you want to apply a pre-set injection pattern, tap Templates to browse Pabau, Community, or Custom injection templates for common treatment areas.
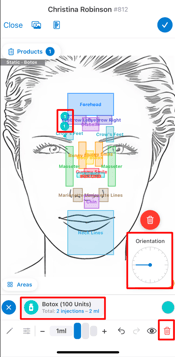
Place Injection Pins
Double-tap anywhere on the face chart to place a pin at that injection site. Each pin is numbered and colour-coded to the selected product. If you selected a specific area, the pin will be placed within that area. If Autodetect is on, the area will be identified automatically based on where you tap.
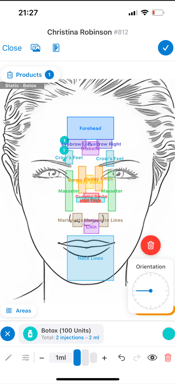
The total number of injections and cumulative dose are shown at the bottom of the screen. You can:
- Tap a placed pin to select and edit it
- Drag from the pin outward to reposition the label
- Adjust the needle orientation using the dial that appears on the right
- Tap the red trash icon to delete selected pins
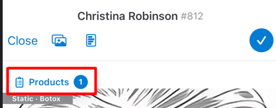
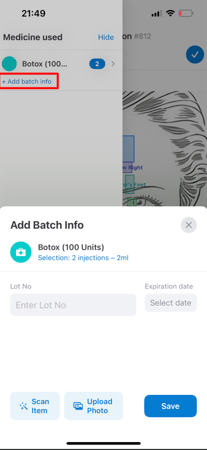
Step 6: Review Products and Add Batch Information
Tap Products at the top of the screen to open the product summary. Here you can see all products used and the total number of injections per product.
Tap a product to open the ''Add Batch Info'' panel, where you can enter the''Lot No'' and ''Expiration date''. You can also tap ''Scan Item'' to scan the product barcode, or ''Upload Photo'' to attach an image of the packaging.
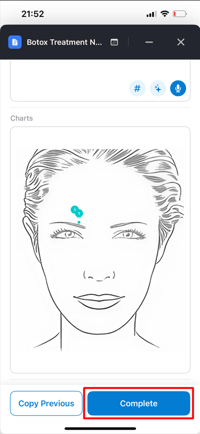
Step 7: Save the Chart and Form
When you are done, tap the blue tick in the top right corner to save the chart. If any product is missing batch information, you will be prompted to add it before proceeding.
Once the chart is saved, tap Complete to save the full treatment form. The record will be saved to the client's EMR tab under ''Forms'', where it can be viewed, printed, or edited at any time.
By following these steps, you can efficiently document injectable treatments directly on the face chart through the care pathway, ensuring accurate and detailed clinical records are maintained in Pabau.
📱Please note: The latest version of Pabau GO requires iOS 17 / iPadOS 17 or later. Devices that can't update to iOS 17 / iPadOS 17 won't be able to run it.
Download Pabau GO on your iPhone or iPad from the App Store.
For more guides, refer to related articles below, select additional guides, or use the search bar at the top of the page. These guides will help you get the most out of your Pabau account.
Additionally, to help you fully utilize and understand your Pabau account, we recommend exploring additional guides and resources offered at the Pabau Academy. It offers in-depth video tutorials and lessons, offering a holistic learning experience that can equip you with the essential skills for achieving success with Pabau.