In Pabau, reports provide information about clients, leads, staff performance, and more. This guide will show you how to access, customize, and create reports, so you can make the most of this powerful feature.
Table of Contents:
1. How to Generate a Standard Report
2. How to Save a Standard Report as a Custom Report
3. How to Edit a Report
4. How to Favorite a Report
5. How to Export Reports
6. How to Share Reports
How to Generate a Standard Report
Step 1: Navigate to the Analytics feature
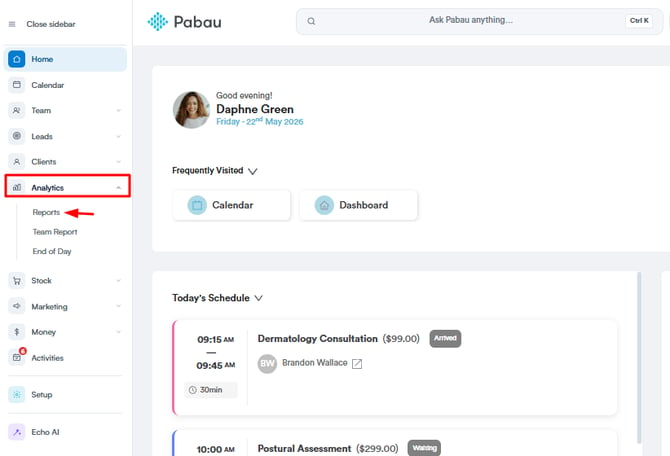
Log in to your Pabau account, and in the left sidebar menu, go to Analytics, then click on the "Reports" button. Once you click on Reports, you will be able to see all of the standard, pre-built reports.
Step 2: Select the Report
Choose the specific report you want to run. You can either browse through the available reports or utilize the search bar in the upper right corner to find the report you need. As an example, we are going to select the "Appointments by Locations" report.

After selecting the report, the report's initial data, using the default values, will appear in the lower section of the screen.
Step 3: Customize Filters
If you want to narrow down your report, you can add and adjust filters to focus on exactly what you need.
Each filter has four elements - object, field, operator, and value.
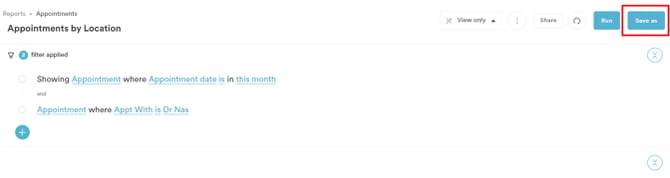
In the screenshot below, you can see an example of the four elements in the "Appointments by Location" report.

- Object: This is what you're focusing on ("Appointment").
- Field: This is the specific detail you're interested in ("Appointment date").
- Operator: This shows how the field relates to the value ("is").
- Value: This is the specific data you’re looking at ("this month").
Each of these elements can be customized by clicking on them and choosing a different option.
For example, if you want to view all appointments except those scheduled for this month, you can change the operator to "is not" to exclude them.

If you want to see all appointments for a specific location during a different time frame, such as last month, last quarter, or any other period, click on the current value (e.g., "this month"). You'll then be able to choose from a list of available options to set your desired time frame.

These examples show just a few options. The system has many filters you can mix and match to create detailed, customized reports.
NOTE: All of the changes made to the filters will be automatically reflected in the report data in the lower section of the screen. If you wish to refresh the data, click on the "Run" button in the top right corner of the screen.
Step 4: Add, edit, and delete filters
To add a filter, click the plus sign below the existing filter, and fill in the new filter details.
To edit a filter, find the filter you want to edit, click on the element you wish to change, select a different option from the dropdown menu, and then save the modifications.
To delete a filter, hover over the filter to delete and click the "X" sign.
Step 5: Edit Columns
If the default column settings don't meet your requirements, click on "Edit Columns" on the right side of the report page.
Here, you can enable or disable columns based on your preferences. After making adjustments, click "Save." To revert to the default columns, click on the "Default" option.

Step 6: Customize Graphs or Pie Charts
If the report includes visual elements like pie charts or graphs, you can customize them. Modify the fields in the "Segment By" and "Measure By" filters located at the top and bottom of the chart or graph.

NOTE: The available fields in the "Segment By" and "Measure By" filters may vary depending on the specific report.
If you have customized your pre-built report, you can save it as a custom report.
By following the steps above, you can easily generate a report, obtaining valuable data for informed decision-making and strategic planning.
How to Save a Standard Report as a Custom Report
Step 1: Navigate to the Analytics feature
Log in to your Pabau account, and in the left sidebar menu, go to Analytics, then click on the "Reports" button.
Step 2: Run a pre-built report and customize it
Generate a pre-built report and customize its filters so that it matches your requirements.
Step 3: Click on the "Save As" Button
After you have customized the report, locate the "Save As" button situated in the top right corner.
Step 4: Name the Report and Lock Filters
After clicking "Save As," provide a descriptive name for your report in the designated field. If you want to secure the applied filters and prevent alterations, tick the "Lock Filters" box. This ensures the report retains its specific criteria.
Tailor the report's accessibility by selecting specific staff members who should have access to it. This step ensures that the right individuals can retrieve and utilize the report as needed.
Once you've named the report and selected staff access, confirm and save your changes. Click on the "Save Changes" button to store the modified report with the specified configurations.

Step 5: Access the saved report
Saved custom reports are conveniently stored under "My Reports" within the Analytics feature.
Once in "My Reports," locate the specific report you wish to access and click on its name. This action will open the saved report, allowing you to view and analyze the data it contains.

Saving your custom reports in "My Reports" makes it quick and easy to find them later. This way, you can easily access and use your customized data whenever you need it. It's a simple way to keep track of important insights and make better decisions for your business.
NOTE: You can also learn about this topic by watching a lesson on Pabau Academy.
How to Edit a Report
Step 1: Navigate to the Analytics feature
Log in to your Pabau account, and in the left sidebar menu, go to Analytics, then click on the "Reports" button. Once you click on Reports, you will be able to see all of the standard, pre-built reports.
Step 2: Find and Open the Saved Custom Reports
Within the "Reports" section, locate the "My Reports" tab on the left side of the screen. Click on this tab to access a list of your saved custom reports. Identify the specific report you want to edit and click on its name to open it.
Once the saved custom report is open, look for the "Edit" button in the top-right corner of the screen.
.webp?width=322&height=254&name=image-png-Dec-13-2023-04-27-55-5537-PM-Jan-26-2024-10-47-35-4434-AM%20(1).webp)
Step 3: Adjust Filters
After clicking "Edit," you'll be taken to the report editing screen. Here, you can adjust the current filters applied to your report. Filters are essential for narrowing down the data, allowing you to focus on specific information.
- To add a filter: Click the plus sign located below any existing filters, then enter the details for your new filter.
- To edit a filter: Find the filter you want to modify. Click on the specific element within that filter you wish to change, select a different option from the dropdown menu, and then save your updates.
- To delete a filter: Hover your mouse over the filter you want to remove and click the "X" icon that appears.
Each filter has four elements - object, field, operator, and value.
In the screenshot below, you can see an example of the four elements in the "Appointments by Location" report.
.webp?width=603&height=238&name=image-png-Dec-13-2023-02-55-40-6828-PM-Jan-26-2024-10-49-09-4279-AM%20(2).webp)
- Object: This is what you're focusing on ("Appointment").
- Field: This is the specific detail you're interested in ("Appointment date").
- Operator: This shows how the field relates to the value ("is").
- Value: This is the specific data you’re looking at ("this month").
Each of these elements can be customized by simply clicking on them and selecting a different option.
For instance:
- If you want your report to include all appointments except those scheduled for the current month, you can change the operator to "is not" to exclude them.
- If you need to view all appointments for a particular location during a different timeframe—such as last month, last quarter, or any other period—just click on the current value (e.g., "this month"). You'll then be presented with a list of available options to set your desired timeframe.
.webp?width=560&height=377&name=image-png-Aug-15-2024-09-57-06-8666-AM%20(3).webp)
These examples show just a few options. The system has many filters you can mix and match to create detailed, customized reports.
NOTE: All of the changes made to the filters will be automatically reflected in the report data in the lower section of the screen. If you wish to refresh the data, click on the "Run" button in the top right corner of the screen.
Step 4: Change the Report Name and Modify Displayed Columns
If you want to change the report's name, simply click on the name field at the top of the editing screen. This will let you edit and update the report name as needed. Renaming the report can make it clearer and reflect any changes in its purpose.
You can also modify the columns shown in the report. The columns displayed help you get the right insights from your data. To edit columns, find the "Columns" box on the left side of the screen. Here, you can add or remove columns to customize the report for your current needs.
.webp?width=576&height=315&name=image-png-Jan-16-2024-02-34-25-2834-PM-4%20(1).webp)
Step 5: Manage Access
After opening the report, in the top right corner of the screen, you'll find the "Manage Access" button, represented by a person icon. Click on this button to access the permissions settings. From here, you can choose who can access the report and define whether they can only view or if they have permission to view and edit the report.
Step 6: Save Changes
Once you've made the necessary edits, don't forget to save your changes by clicking on the "Save" button in the top right corner. This step ensures that the updated custom report reflects the modifications you've made.
NOTE: You can also learn about this topic by watching a lesson on Pabau Academy.
How to Favorite a Report
Step 1: Navigate to the Analytics feature
Log in to your Pabau account, and in the left sidebar menu, go to Analytics, then click on the "Reports" button.
Step 2: Open the Desired Report
Browse through the list of available reports to find the one you want to mark as a favorite, then click on the report to open it and view its contents.
Step 3: Add the Report to Favorites
Once you have the desired report open, look for the three dots icon located in the top right corner of the screen.
Click on the three dots icon to open the dropdown menu and click on the "Add to Favorites" option. This action will mark the report as a favorite.

Step 4: Access Favorited Reports
To easily identify your favorited reports on the Reports page, look for the blue star icon next to their names.
Alternatively, you can access all your favorited reports by navigating to the "Favorites" tab on the Reports page.
Step 5: Remove a Report from Favorites
If you want to remove a report from your favorites, start by opening the report you wish to unmark.
Once the report is open, find the three dots icon in the top-right corner of the screen. Click on it, then select the "Remove from Favorites" option.
The report will no longer show up under the "Favorites" tab, and the blue star icon will be removed from its name on the "Reports" page.
By following these simple steps, you can efficiently manage your favorite reports within the Analytics feature, streamlining your workflow and ensuring quick access to the data that matters most to you.
How to Export Reports
Step 1: Navigate to the Analytics feature
Log in to your Pabau account, and in the left sidebar menu, go to Analytics, then click on the "Reports" button.
Step 2: Run or Create a Report
Run a pre-built report or create a custom one based on your specific requirements.
Ensure that the report is generated and displays the insights you want to export.
Step 3: Export the Generated Report
When ready to export, click on the three dots icon positioned in the top right corner of the page, then select the "Export" option.

Step 4: Choose File Format and Initiate Export
After clicking "Export," a menu will appear. Pick the desired file format for the export - Excel or CSV.
Once you've chosen the file format, click the "Export" button to start the download of the report in the selected format.

Step 5: Download the Report
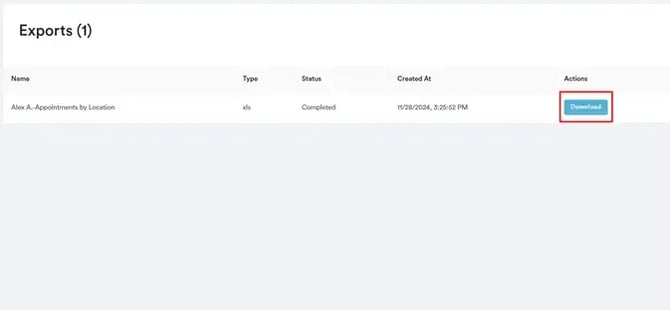
Once you've started the report export, return to the Analytics page, click "Options" in the top right corner, and select "Exports."
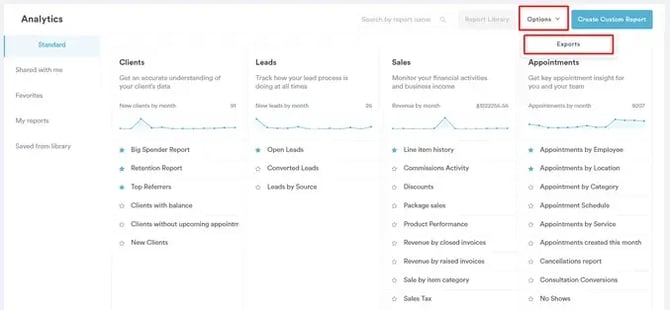
On the Exports page, you'll find all the reports you've started exporting. To download a report, simply click "Download."
You can download a report up to 1 hour after exporting it; after that, it will no longer be available for download.
In addition to exporting, you can also print a report directly from the three-dot menu. Simply select Print (snapshot) or Print (detailed) to open a clean, print-ready view of your report in your browser. This allows you to print the report or save it as a PDF using your browser’s print dialog.

By following these steps, you can easily share and make use of valuable insights, improving your decision-making with Pabau data.
How to Share Reports
Step 1: Navigate to the Analytics feature
Log in to your Pabau account, and in the left sidebar menu, go to Analytics, then click on the "Reports" button.
Step 2: Run or Create a Report
Choose to run one of the pre-built reports or create a custom report tailored to your needs. Ensure the report is generated and displays the insights you want to share.
Step 3: Share the Generated Report
When ready to share, locate the "Share" button in the top right corner of the page. Click on the button to generate a link to the report that can be shared with anyone.

This link allows recipients to open and view the report without needing to log into Pabau.
By following these steps, you can easily navigate, generate, and share reports within Pabau, promoting effective collaboration and accessibility to valuable insights.
NOTE: You can also learn about this topic by watching a lesson on Pabau Academy.
Additionally, to help you fully utilize and understand your Pabau account, we recommend exploring additional guides and resources offered at the Pabau Academy. It offers in-depth video tutorials and lessons, offering a holistic learning experience that can equip you with the essential skills for achieving success with Pabau.