Understanding where your clients come from is crucial for optimizing your marketing strategies and allocating resources effectively.
In Pabau, you can run a marketing source report that will show you the effectiveness of your marketing efforts.
To ensure the report yields meaningful data, it's essential to gather marketing source information for all clients. This involves either including marketing source details during manual client creation or updating the "Referred by" field in client profiles afterward.
For new clients booking online, consider incorporating a "How did you hear about us?" field in the online booking registration form. The field can be visible but not required, however, to ensure comprehensive data collection, it's advisable to make it a required field.
Once these prerequisites are met and marketing source data is collected for all clients, you can generate a report illustrating client acquisition within specific timeframes, categorized by marketing source.
To proceed, follow the steps outlined below:
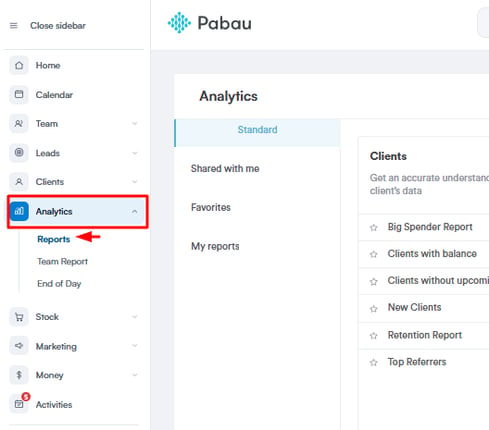
Step 1: Navigate to Analytics
Log in to your Pabau account and click on "Analytics" in the left sidebar menu, then select "Reports."
Step 2: Creating the Custom Report
Click on "Create Custom Report" in the top right corner of the Analytics feature and choose "Clients" as the Data object. Select "Start from scratch" to begin.
By default, the report will include clients created within the current year. You can adjust this timeframe according to your needs. Remember that the timeframe can be modified later, and the report will be updated accordingly.

Optionally, you can add more filters to refine the report's specificity by clicking on the blue plus sign.
Step 3: Segmenting Clients by Marketing Source
This filter will give you a basic list of all the clients created in the designated timeframe. However, it also acts as the basis for segmenting clients by their marketing sources.
To visualize the segmentation of clients by marketing source, utilize the pie chart or donut data visualization tools above the list of clients.

Click on the "Segment by" option above the chart and select "Client source." This will display a visual representation of clients created within the specified timeframe categorized by marketing source.

If you wish, you can customize the report by adding more columns to the left-hand side, which will display additional client information.

Step 4: Saving and Accessing the Report
Once satisfied with the report setup, name the report at the top of the screen and click on "Save Report" in the top right corner to save it.
The report will now be accessible in the "My Reports" tab under Analytics, allowing you to reference it at any time.
Step 5: Dynamic Report Updates
Keep in mind that all filter fields in the report are adjustable. Any changes made to the filters, such as modifying the timeframe, will result in real-time updates to the report.
By following these steps, you can efficiently track and analyze the performance of your marketing sources in Pabau, enabling informed decision-making and optimization of your marketing strategies.
For more guides, refer to related articles below, select additional guides, or use the search bar at the top of the page. These guides will help you get the most out of your Pabau account.
Additionally, to help you fully utilize and understand your Pabau account, we recommend exploring additional guides and resources offered at the Pabau Academy. It offers in-depth video tutorials and lessons, offering a holistic learning experience that can equip you with the essential skills for achieving success with Pabau.