The leads by source report tracks where your leads are coming from, breaking them down by specific sources such as social media, email campaigns, referrals, or other marketing sources that you've created in Pabau.
For more information on marketing sources in Pabau, review this article.
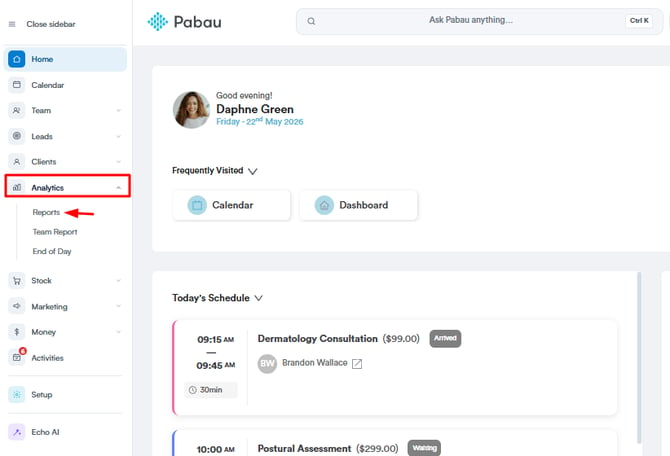
Step 1: Navigate to Analytics
Start by logging into your Pabau account using your login credentials. Then, navigate to the left sidebar menu, where you can find the Analytics tab. Click to expand it, and it will reveal 'Reports.'
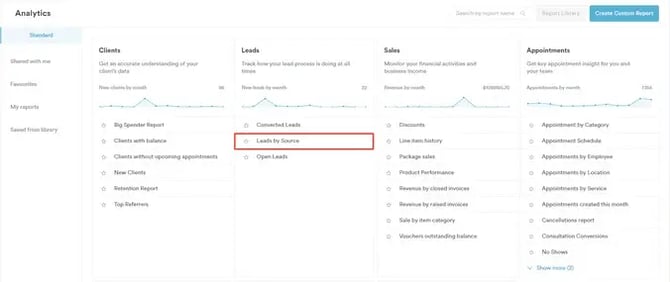
Step 2: Generate the Leads by Source Report
Under the 'Leads' section, you will find the Leads by Source pre-created report. Click on the report name to continue.
Step 3: Adjust the Filters
If you want to narrow down your report, you can add and adjust filters to focus on exactly what you need.
Each filter has four elements - object, field, operator, and value.
In the screenshot below, you can see an example of the four elements in the "Leads by Source" report.

- Object: This is what you're focusing on ("Lead").
- Field: This is the specific detail you're interested in ("Lead Created").
- Operator: This shows how the field relates to the value ("is").
- Value: This is the specific data you’re looking at ("this year").
Each of these elements can be customized by clicking on them and choosing a different option.
For example, if you want to view all leads except those you have won this month, you can change the operator to "is not" to exclude them.

This example shows just a few options. The system has many filters you can mix and match to create detailed, customized reports.
NOTE: All of the changes made to the filters will be automatically reflected in the report data in the lower section of the screen. If you wish to refresh the data, click on the "Run" button in the top right corner of the screen.
Step 4: Add, edit, and delete filters
- Adding a New Filter: To introduce an additional filter, click the plus sign (+) located beneath your current filters. Then, specify the details for your new filter.
- Editing an Existing Filter: Locate the filter you wish to modify. Click directly on the element you want to adjust (such as the object, field, operator, or value). A dropdown menu will appear; choose your desired new option. Your changes should save automatically, or you may need to click an "Update" or "Apply Filters" button.
- Removing a Filter: To delete a filter, simply move your mouse cursor over it. An "X" icon will appear; click it to remove the filter.

Step 5: Review the Data
Once you've adjusted the filters, you can view the data in a donut and list view.
In a donut view, you can segment the data by lead names, lead sources, staff member whom the lead is assigned (Owner), staff member who created the lead in Pabau (Creator), label you've added to the lead, lead status, pipeline stage and more.

If you scroll down, you can view the data displayed in a list view. You can add additional columns for more specific details to be shown.
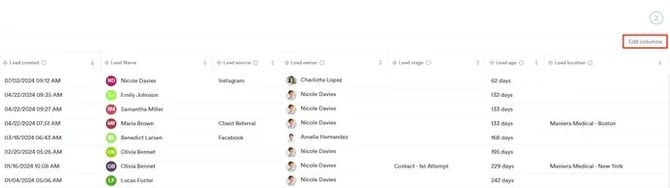
Some of the columns include:
- Lead Name: to be able to see the name of the lead, and through which you can access their lead card
- Won Time: displays when the lead was marked as won
- Lead Created: shows the date when the lead was created in Pabau
- Lead Stage: displays what pipeline stage the lead is in. For more information regarding lead pipelines, review this article.
- Lead Source: shows the marketing source through which the lead discovered your practice. For more information regarding marketing sources in Pabau, review this article.
After selecting any additional columns, click "Save" so that they will appear on the list. You can also deselect options that are currently included in the columns.

Step 6: Export the Data
To export the data from this report, simply click on the three dots on the top right side of the screen to reveal the 'Export' button.

Once you click Export, a window will pop up, and you can choose to export the data as an Excel or CSV file.
.webp?width=630&height=292&name=image-png-Aug-30-2024-08-45-54-8576-AM%20(3).webp)
By following these steps, you can easily generate the leads by source report.
For more guides, refer to related articles below, select additional guides, or use the search bar at the top of the page. These guides will help you get the most out of your Pabau account.
Additionally, to help you fully utilize and understand your Pabau account, we recommend exploring additional guides and resources offered at the Pabau Academy. It offers in-depth video tutorials and lessons, offering a holistic learning experience that can equip you with the essential skills for achieving success with Pabau.