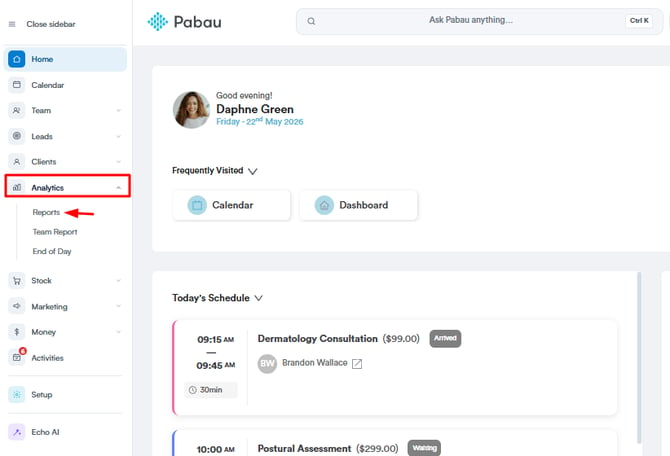
Step 1: Navigate to the Analytics Feature
Log in to your Pabau account, and in the left sidebar menu, go to Analytics, then click on the "Reports" button.
Step 2: Choose Report
To refine your report, you'll use filters. Each filter consists of four parts:
- Object: The primary subject of your report (e.g., "Appointment").
- Field: The specific data point you want to filter by (e.g., "Appointment Date" or "Team").
- Operator: The rule that connects the field to the value (e.g.,
is,is not,contains). - Value: The specific criteria you want to use (e.g.,
This Monthor the name of a specific team).
You can click on any of these elements to change them and customize the report to your needs.
.webp?width=603&height=238&name=image-png-Dec-13-2023-02-55-40-6828-PM-Jan-26-2024-10-49-09-4279-AM%20(3).webp)
To view data for only one or more specific teams, you need to add a filter.
- Click to add a new filter or modify an existing one.
- Set the Field to "Team".
- Set the Operator to "is".
- In the Value field, select the name of the team you want to analyze from the dropdown list.
The report will update to show results exclusively for the selected team. Each of these elements can be customized by clicking on them and choosing a different option.
In this screenshot, you can see an example of the four elements in two filters in the "Appointments by Category" report.
.webp?width=492&height=241&name=image%20(27).webp)
Step 3: Apply Team Filter
If you'd like to include only specific employees from the teams you've created using the Team feature, you can add a condition. Add a filter where the field is "Team", the operator is "is", and in the value element, choose the specific team you want to include.

Step 4: Segment By Teams
If you want to see a side-by-side comparison of all teams within a single report, use the "Segment by" feature. This is ideal for appointment and sales reports where you want to compare staff performance.
- Locate the "Segment by" dropdown menu, typically located above the report results.
- Click it and select "Team".
The report's data and visuals (like pie charts or bar graphs) will now be broken down, showing distinct results for each team. This allows for easy comparison of performance across different groups.

By following these steps, you can run reports filtered by teams in your Pabau account.
For more guides, refer to related articles below, select additional guides, or use the search bar at the top of the page. These guides will help you get the most out of your Pabau account.
Additionally, to help you fully utilize and understand your Pabau account, we recommend exploring additional guides and resources offered at the Pabau Academy. It offers in-depth video tutorials and lessons, offering a holistic learning experience that can equip you with the essential skills for achieving success with Pabau.