
The New Memberships report tracks acquisition — every membership sold (signed up) within a date range.
It answers: how many new members did we sign up, which plans they chose, how much was billed on the first invoice, where they were sold, and whether signups are trending up or down versus the previous period. A membership counts as a "new signup" based on its sign-up (sale) date.
For example, if a client signs up to the "Skin Health Gold" plan on 14 June, and the date filter is set to "Last 30 days" (covering roughly 15 May–14 June), that signup appears in this report — even if their first payment is still pending.
How to find it
Step 1: Navigate to the Analytics Feature
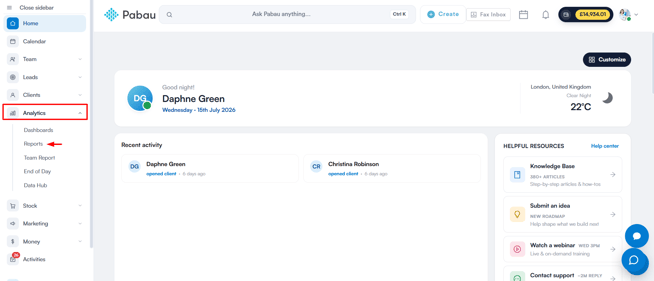
Log in to your Pabau account, and in the left sidebar menu, go to Analytics, then click on the "Reports" button.
Step 2: Access the reports banner
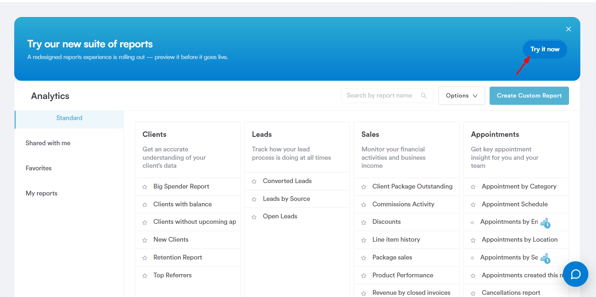
On the "Try our new suite of reports" banner, click Try it now.
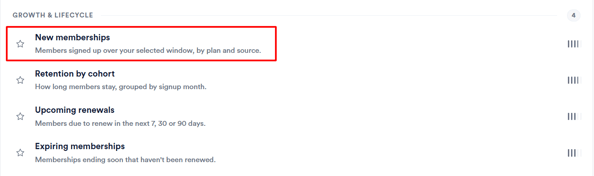
Once you're in the new reports view, go to the Memberships section then scroll to the "Growth & Lifecycle" group and click on New memberships to open the report.
NOTE: The Memberships reports are visible only to users whose staff permissions include "Can access sales company reports". If you can’t see the Memberships section in the reports catalog, ask an administrator to grant this permission.
Toolbar controls
| Button | What it does |
|---|---|
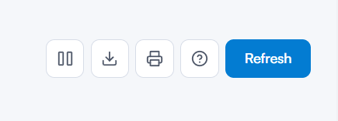
| Columns | Opens the column manager — show or hide any of the 8 table columns. Your choice is remembered in your browser for this report. |
| Export | Downloads the on-screen table as a CSV file (e.g. new-memberships-2026-06-26.csv). |
| Opens your browser's print dialog, formatted for A4 landscape. | |
| Help | Opens the in-app help modal — an overview, how-to steps, and a definition of every column. |
| Refresh | Re-runs the report with your current filters, showing "Refreshing…" while loading. |
Filters
- Signup Date – Required. The date range the report analyses, matched against each membership's sign-up date. Defaults to the last 30 days, with presets for Today, Last 7 days, Last 30 days, and Last 90 days, or a custom range up to a maximum span of 365 days.
- Locations – Optional, multi-select, searchable. Defaults to All locations. A special "No location" entry matches memberships with no location attached.
- Plan – Optional, multi-select, searchable. Defaults to All plans.

Understanding the report
The KPI cards
These summarise the entire filtered date range, not just the rows shown in the table below.
| Card | Main value | Sub-text |
|---|---|---|
| New Signups | Total memberships sold in the window. | Trend versus the previous equal-length window. |
| First Invoice Revenue | Total of all first-invoice amounts. | The average first payment per signup. |
| Top Plan | Name of the most-sold plan. | Its signup count and share of the mix. |
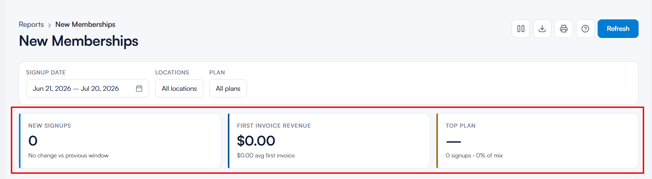
NOTE: The New Signups trend compares your window against the window of the same length immediately before it. For example, with "Last 30 days" selected, 40 signups this month against 32 the previous month shows "▲ 25.0% vs previous window." If the previous window had zero signups but this one has some, it reads "New — no signups in previous window". If both are equal, it reads "No change vs previous window."
Signups over time (chart)
A stacked bar chart of signups, coloured by plan. Use the view toggle to switch between:
- Daily – one bar per day.
- Weekly – bars grouped by week.
- By plan – one bar per plan, totalled for the window.
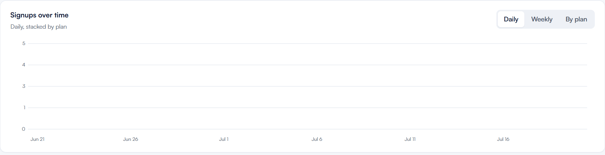
Hover a bar to see the per-plan counts and the day's total — plan names and colours appear on hover, as there's no permanent legend.
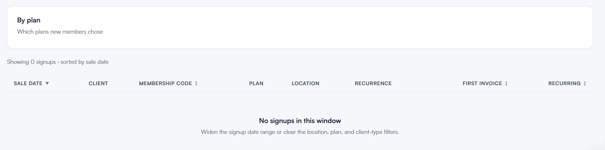
By plan (breakdown card)
A ranked list showing which plans new members chose. Each row shows a colour dot and plan name, a proportional bar, the count, the % share, and the revenue. Plans are sorted by signup count, then by revenue.
The table
Default sort is Sale Date, newest first. Hover any column header for its definition.
| Column | What it shows | Sortable |
|---|---|---|
| Sale Date | The date the membership was purchased — the day the signup counts toward. | Yes |
| Client | The member who bought the membership. Click the name to open their client card. | No |
| Membership Code | The system-generated identifier for the membership record. | Yes |
| Plan | The membership plan (template) that was sold, with its colour dot. | No |
| Location | The location where the membership was sold. | No |
| Recurrence | Badge showing how the member pays: Weekly, Monthly, Annual, or One-off. | No |
| First Invoice | The first payment amount taken when the membership was sold. | Yes |
| Recurring | The plan's ongoing recurring amount: /wk, /mo, /yr, or a plain amount for one-off. | Yes |
For example, a membership sold as an annual contract shows Recurrence Annual and Recurring as a per-year amount (e.g. £750.00/yr), while a one-off package shows Recurrence One-off and Recurring as a plain amount with no per-period suffix.
With this understanding, you can confidently use the New Memberships report to see how many members you're signing up, which plans are performing best, and how your acquisition is trending over time.
Was this guide helpful? Let us know by voting below - your feedback helps us write clearer articles.
For more guides, browse the related articles below or use the search bar at the top of the page. You can also watch our video learning series, the Pabau Academy, or visit the Support page for additional help.