
This feature is part of the new client card version and is currently available to select users only, starting August 2026. A wider rollout to all accounts is coming soon.
Outcome measures turn the scored answers a client gives on your forms into trend charts, right inside their client card. Every time a form with a configured measure is completed for the client, the new score is plotted automatically — so you can evidence progress between visits, spot deterioration early, and review a per-visit breakdown without any manual charting.
This guide covers viewing and tracking measures on the client card. The measures themselves are configured on your medical forms — if you haven’t set any up yet, start with How to Set Up and Track Outcome Measures.
1. Open the Measures section
- Navigate to Clients and open the client’s card — for example, Emma Thompson.
- In the navigation bar at the top of the client card, click EMR. For businesses based in the United States, this section is labelled Chart.
- Click the Measures card — it shows Outcomes underneath its name.
The Measures page shows one card for each form that has a measure configured and at least one completed submission for this client.
Note: Outcome measures are switched on per business. If you don’t see the Measures card in this section, contact Pabau support to have it enabled.
If the client has no scored submissions yet, you’ll see “No outcomes to chart yet” instead. Click Set up measures to jump to Setup > Medical Forms, where measures are configured — the section fills in automatically once a measured form is completed for the client.
2. Read a measure card
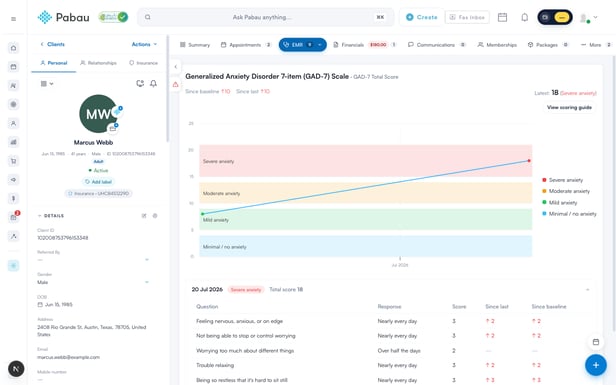
Each card is headed with the form’s name and summarises the client’s progress at a glance:
- Latest — the most recent score, with its severity shown in the matching colour (for example, “Latest: 8 (Mild)”).
- Since baseline — the change between the latest score and the client’s very first recorded submission.
- Since last — the change since the previous submission.
Falling scores display in green and rising scores in red, since outcome questionnaires typically score symptom severity — lower is better. When nothing has moved, the summary simply reads “No change”.
Beneath the summary sits the chart itself:
- With a single submission on record, the score displays as a gauge, so you still get an instant visual read.
- From the second submission onwards, scores plot as a trend line over time. If severity ranges are configured for the measure, they appear as colour-shaded bands behind the line, with a legend beside the chart. Hover over any point to see the exact score and its severity.
Measures without severity ranges — vitals such as weight, for instance — chart as a plain trend line, with no bands, severity labels, or scoring guide.
If a measured field’s recorded answers contain no numbers, the card explains that the values aren’t numeric and can’t be plotted over time. Review the field on the form to make sure it captures a numeric value.
3. Compare several measures on one form
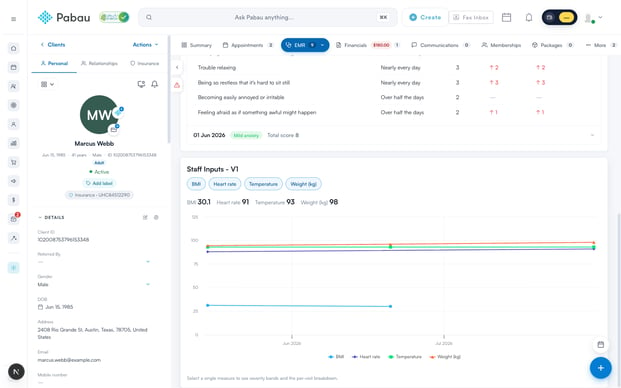
When one form charts more than one measure, a row of chips appears at the top of its card — one per measure, all selected by default:
- With several measures selected, the card overlays one line per measure on a single chart, with a legend underneath and each measure’s latest score listed above.
- Click a chip to remove that measure from the chart, or click it again to bring it back. At least one measure always stays selected.
- Narrow the selection down to a single measure to see the full detail view — severity bands, the change summary, the scoring guide, and the per-visit breakdown.
4. Review individual submissions
Under a single measure’s chart, the client’s submissions are listed newest first, with the most recent expanded automatically. Each row shows the submission date, its severity, and the total score.
Expand a submission to see the question-by-question breakdown:
- Question and Response — the field and the answer the client gave.
- Score — the points that answer contributed to the total.
- Since last and Since baseline — how each individual answer’s score moved against the previous submission and against the very first one.
The per-question changes are ideal for pinpointing exactly which answer is driving a change in the total score.
5. Open the scoring guide
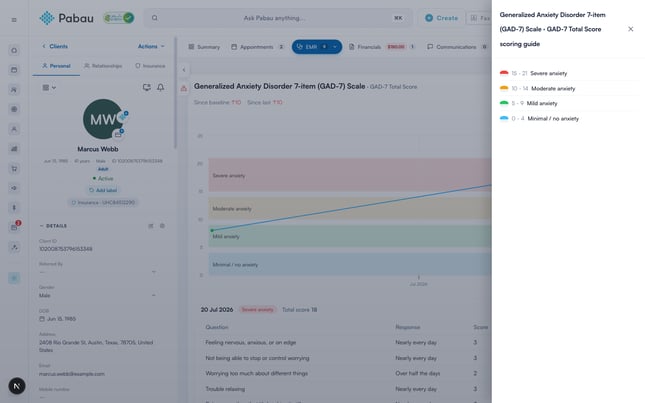
- Narrow the card to a single measure, if the form charts more than one.
- Click View scoring guide in the top-right of the card.
- A panel slides in from the right, listing every severity band for the measure — from most to least severe — with its colour, score range, and name.
The View scoring guide button only appears for measures that have severity ranges configured.
6. Jump to a measure from a treatment note
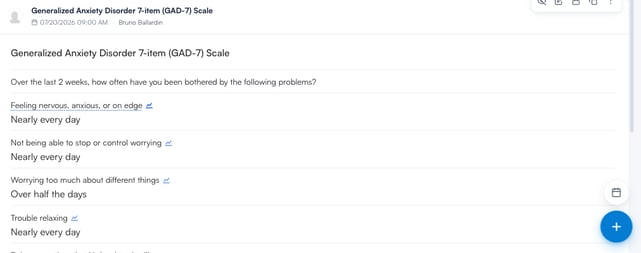
You don’t need to open the Measures section manually every time. When viewing a treatment note, any field with a measure configured shows a small trend icon beside its label:
- Go to EMR > Treatment notes and expand one of the client’s notes.
- Click a field label carrying the trend icon — hovering over it shows “View history in Measures”.
- The Measures section opens with that measure’s chart scrolled into view, briefly highlighted, and narrowed to the field you clicked.
That’s it — with measures configured on your forms, every completed submission builds the client’s outcome history automatically, and the Measures section keeps the full story a couple of clicks away.
Was this guide helpful? Let us know by voting below - your feedback helps us write clearer articles.
For more guides, browse the related articles below or use the search bar at the top of the page. You can also watch our video learning series, the Pabau Academy, or visit the Support page for additional help.