
Outcome measures let you track a client's scored form responses over time. Mark any field on a form as a measure — a vital sign a staff member types in, or a questionnaire total such as a GAD-7 score — and every completed submission of that form plots onto a trend chart on the client's card. You can band scores by severity (for example "Mild anxiety" or "Obese"), watch the change since the previous visit and since the baseline, and jump straight from a treatment note to the chart behind it.
NOTE: Measures are configured per form, and results appear on the client card once a form with a configured measure has at least one completed submission for that client.
Setting up measures on a form
Step 1: Open the measure editor
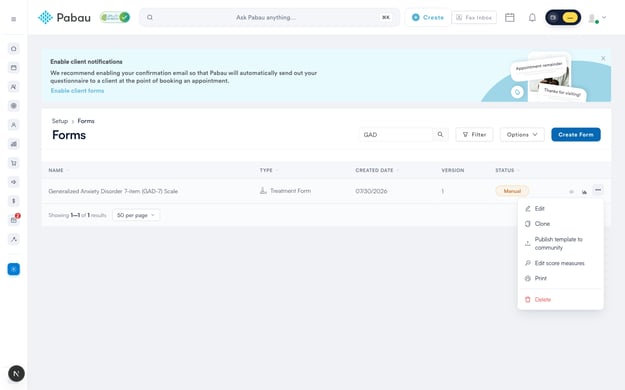
From the main dashboard, click Setup in the left-hand navigation, then select Medical Forms under Clinical. Find the form you want to measure, click the three-dot menu at the end of its row, and choose Edit score measures.
Step 2: Choose which fields to measure
The measure editor opens with a Measure configuration panel on the left listing the form's fields. Switch on every field you want to track — each enabled field becomes its own chart on the client card, so you can measure Weight, BMI and Heart rate side by side on a single form. Any field where a number is entered can be measured; Pabau reads the first number in the answer, so a value typed as "60.0kg" is charted as 60.
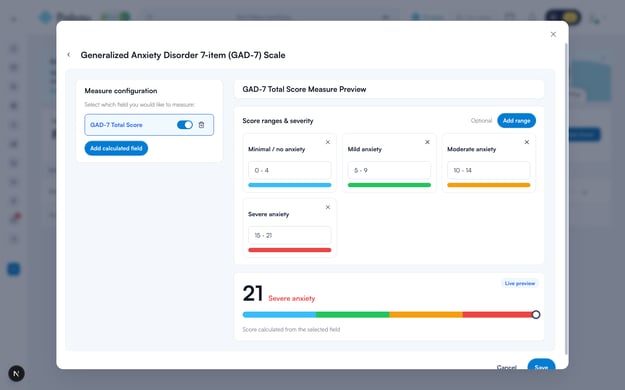
Click an enabled field to configure it. The right-hand side shows its optional severity ranges and a live preview.
Step 3: Add severity ranges (optional)
Under Score ranges & severity, click Add range to band the score. Each range card takes a severity label (for example "Moderate anxiety"), a value range such as 10 - 14, and a colour — the colours become the shaded bands behind the client's trend chart. The Live preview at the bottom shows the score and its severity exactly as they will appear.
Ranges are entirely optional. Leave them empty and the measure simply plots its values over time — ideal for vitals like weight or heart rate where a severity banding wouldn't make sense.
Step 4: Score a questionnaire with a calculated field
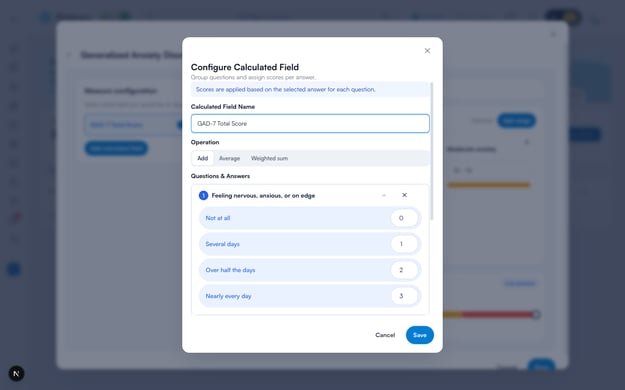
To chart a total across several questions — the way GAD-7, PHQ-9 and similar questionnaires are scored — click Add calculated field in the left panel. Give the calculated field a name, pick an operation (Add, Average or Weighted sum), then add each multiple-choice question and assign a score to every answer. The score is applied based on the answer the client selects, and the operation combines the questions into one total.
Step 5: Save
Click Save. Every switched-on field is saved as its own measure and starts charting from the form's existing submissions straight away. To stop tracking a field, switch it off and save — its measure is removed, and the other measures on the form are untouched.
NOTE: Measures follow the field's name, so they survive normal form edits. If a measured field is later renamed or removed from the form, the measure editor flags that measure as broken — existing results remain on the client card, but new submissions won't record against it until you restore the field's original name or switch the measure off.
Tracking results on the client card
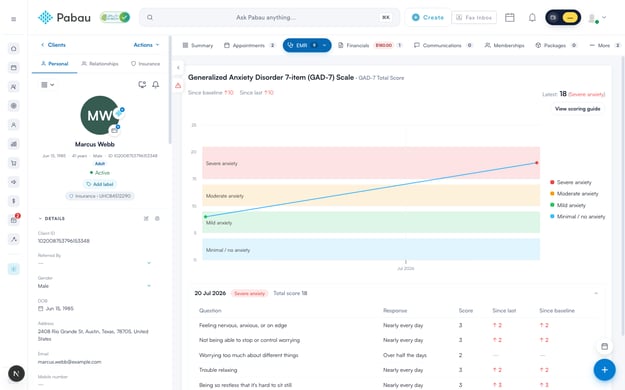
Open the client's card and go to EMR → Measures. Each form with measures gets its own card. With a single measure selected you see the full picture: the trend line over the coloured severity bands, the Latest score with its severity label, the change Since baseline and Since last, and a per-visit breakdown listing every question, the response given, its score, and how it moved between visits.
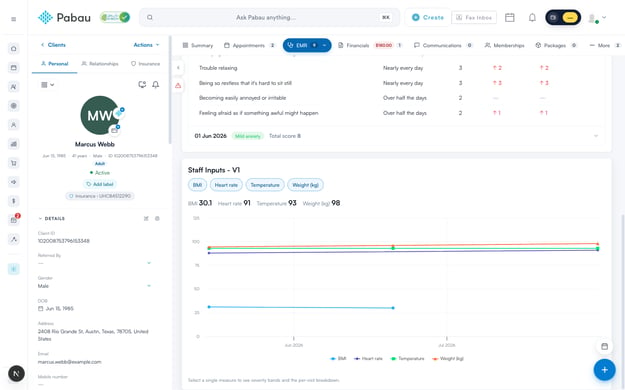
When a form tracks several measures, its card overlays them on one chart with a chip for each measure and a strip of the latest values. Toggle chips to compare exactly the measures you're interested in — narrow it down to a single measure to bring back the severity bands and the per-visit breakdown.
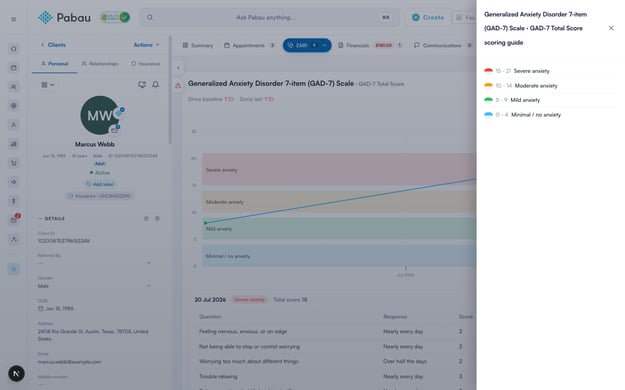
Click View scoring guide on any banded measure to open a side panel listing its score ranges and severity labels — handy when reading a chart with a client.
Jumping from a treatment note
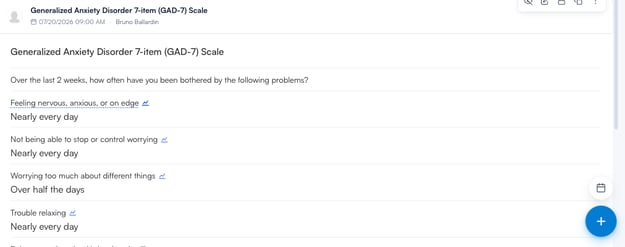
On the client's Treatment Notes, every measured field label carries a small trend icon. Click the label to jump straight to that measure's chart on the Measures tab, already focused on the field you clicked. For a questionnaire scored with a calculated field, every scored question links to the total-score chart.
For more guides, refer to the related articles below or use the search bar at the top of the page. To build the form itself, see How to Create a Medical Form — and to chart a measure on a printed document, add a Measure trend block to a custom print template.
By following the steps above, you can set up outcome measures on your forms and track how a client's scores change over time.
Was this guide helpful? Let us know by voting below - your feedback helps us write clearer articles.
For more guides, browse the related articles below or use the search bar at the top of the page. You can also watch our video learning series, the Pabau Academy, or visit the Support page for additional help.