
You can edit a saved custom report from two places: the new reports homepage (via each report's three-dot menu and the report builder) or the classic Reports page. This guide covers both.
Step 1: Navigate to the Analytics feature
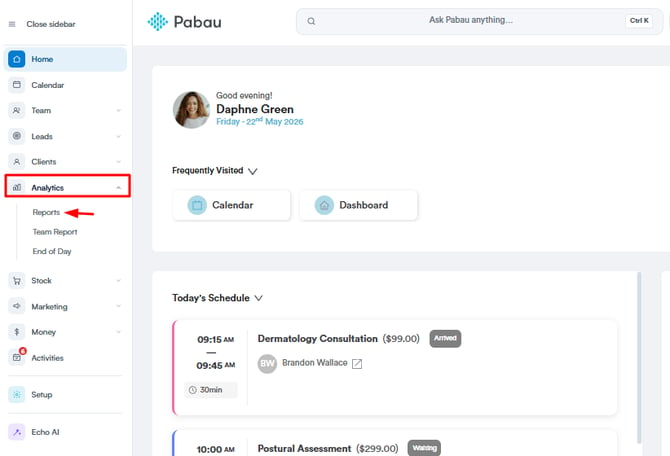
Log in to your Pabau account, and in the left sidebar menu, go to Analytics, then click on the "Reports" button. Once you click on Reports, you will be able to see all of the standard, pre-built reports.
Editing from the new reports homepage
If your account uses the new reports homepage (opened via the "Try our new suite of reports" banner — see our New Suite of Reports guide), you manage custom reports directly from the report list.
Step 2: Open "My reports"
In the left sidebar of the reports homepage, click My reports to see the custom reports you've saved.
Step 3: Use the three-dot menu
Each report row has a three-dot menu on the right with everything you need to manage the report:
- Rename — edit the report's name directly in the list.
- Manage access — control who can open or change the report (see the next step).
- Duplicate — create a copy of the report to experiment with.
- Go to [data type] — jump to the Pabau page for the data the report is built on (for example, "Go to Clients").
- Change ownership — transfer the report to another team member. Pick the new owner and confirm — they become the report's owner from then on.
- Customize — open the report in the report builder, where you can change its filters, columns, and chart, then save your changes.
- Delete — permanently remove the report. You'll be asked to confirm, as this cannot be undone.
NOTE: Rename, Manage access, Change ownership, and Delete only appear on reports you own.
Step 4: Manage access
Choosing Manage access opens the "Who can access this report" panel. Pick one of the access levels:
- Private to the creator — only you can open the report.
- Everyone can access — all employees in your account can open it.
- Specific users or teams — choose exactly who, and what they can do. Each person can be set to Hidden (cannot see the report), View only (can open, not change), or View & edit (can open and change). Use the "Set all" options to apply a level to everyone at once — Hide from everyone, Everyone can view, or Everyone can edit — and assign whole teams where you use them.
Click Save access to apply your changes.
Step 5: Edit from the report itself
You can also open the report and adjust its filters and columns directly in the report viewer. A Save as button appears once you make a change — it keeps the original report unchanged and saves your version as a new report. To change the saved report itself, use Customize from the three-dot menu.
Editing from the classic Reports page
On the classic Reports page, editing happens inside the report's editing screen, starting from the "My Reports" tab.
Step 2: Find and Open the Saved Custom Reports
Within the "Reports" section, locate the "My Reports" tab on the left side of the screen. Click on this tab to access a list of your saved custom reports. Identify the specific report you want to edit and click on its name to open it.
Once the saved custom report is open, look for the "Edit" button in the top-right corner of the screen.
.webp?width=322&height=254&name=image-png-Dec-13-2023-04-27-55-5537-PM-Jan-26-2024-10-47-35-4434-AM%20(1).webp)
Step 3: Adjust Filters
After clicking "Edit," you'll be taken to the report editing screen. Here, you can adjust the current filters applied to your report. Filters are essential for narrowing down the data, allowing you to focus on specific information.
- To add a filter: Click the plus sign located below any existing filters, then enter the details for your new filter.
- To edit a filter: Find the filter you want to modify. Click on the specific element within that filter you wish to change, select a different option from the dropdown menu, and then save your updates.
- To delete a filter: Hover your mouse over the filter you want to remove and click the "X" icon that appears.
Each filter has four elements - object, field, operator, and value.
In the screenshot below, you can see an example of the four elements in the "Appointments by Location" report.
.webp?width=603&height=238&name=image-png-Dec-13-2023-02-55-40-6828-PM-Jan-26-2024-10-49-09-4279-AM%20(2).webp)
- Object: This is what you're focusing on ("Appointment").
- Field: This is the specific detail you're interested in ("Appointment date").
- Operator: This shows how the field relates to the value ("is").
- Value: This is the specific data you’re looking at ("this month").
Each of these elements can be customized by simply clicking on them and selecting a different option.
For instance:
- If you want your report to include all appointments except those scheduled for the current month, you can change the operator to "is not" to exclude them.
- If you need to view all appointments for a particular location during a different timeframe—such as last month, last quarter, or any other period—just click on the current value (e.g., "this month"). You'll then be presented with a list of available options to set your desired timeframe.
.webp?width=560&height=377&name=image-png-Aug-15-2024-09-57-06-8666-AM%20(3).webp)
These examples show just a few options. The system has many filters you can mix and match to create detailed, customized reports.
NOTE: All of the changes made to the filters will be automatically reflected in the report data in the lower section of the screen. If you wish to refresh the data, click on the "Run" button in the top right corner of the screen.
Step 4: Change the Report Name and Modify Displayed Columns
If you want to change the report's name, simply click on the name field at the top of the editing screen. This will let you edit and update the report name as needed. Renaming the report can make it clearer and reflect any changes in its purpose.
You can also modify the columns shown in the report. The columns displayed help you get the right insights from your data. To edit columns, find the "Columns" box on the left side of the screen. Here, you can add or remove columns to customize the report for your current needs.
.webp?width=576&height=315&name=image-png-Jan-16-2024-02-34-25-2834-PM-4%20(1).webp)
Step 5: Manage Access
After opening the report, in the top right corner of the screen, you'll find the "Manage Access" button, represented by a person icon. Click on this button to access the permissions settings. From here, you can choose who can access the report and define whether they can only view or if they have permission to view and edit the report.
Step 6: Save Changes
Once you've made the necessary edits, don't forget to save your changes by clicking on the "Save" button in the top right corner. This step ensures that the updated custom report reflects the modifications you've made.
For more guides, refer to related articles below, select additional guides, or use the search bar at the top of the page. These guides will help you get the most out of your Pabau account.
Additionally, to help you fully utilize and understand your Pabau account, we recommend exploring additional guides and resources offered at the Pabau Academy. It offers in-depth video tutorials and lessons, offering a holistic learning experience that can equip you with the essential skills for achieving success with Pabau.