
The Client Lifecycle Flow report shows how clients moved between lifecycle stages over a chosen period.
It answers one question: over this period, how many clients became new, came back, climbed to loyal, stayed active, or fell away? Unlike most reports, this isn't a client list — it's a flow (Sankey) diagram showing movement between stages.
How to find it
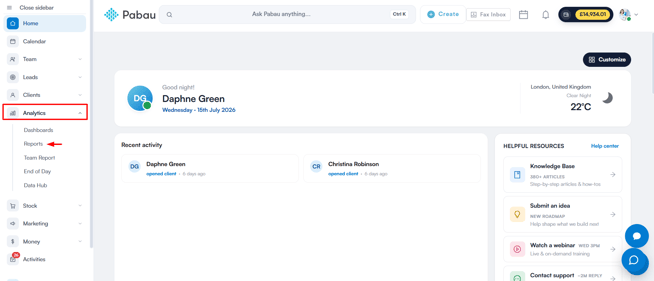
Step 1: Navigate to the Analytics Feature
Log in to your Pabau account, and in the left sidebar menu, go to Analytics, then click on the "Reports" button.
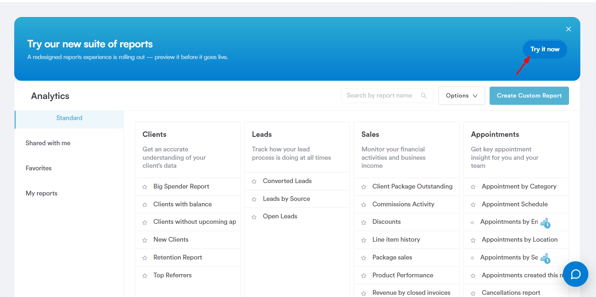
Step 2: Access the reports banner
On the "Try our new suite of reports" banner, click Try it now.
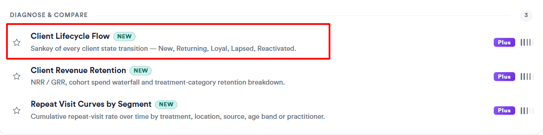
Once you're in the new reports view, go to the Clients section then scroll to the "Diagnose & compare" group and click on Client Lifecycle Flow to open the report. The tile carries "New" and "Plus" badges — Client Lifecycle Flow is one of the Plus reports, and you’ll also find it on the Featured tab under "Pabau featured reports".
Filters
- Period – The date range being analysed. Presets cover Last 30 days, Last quarter, Year to date, and Trailing 12 mo, and the default is the last 30 days.
- Location – Exactly one location.
- Comparison – Has a single option, "vs. prior period". In this first version it’s informational only — the report always shows the selected period on its own, and the comparison isn’t applied yet.

Understanding the report
How it works
The report takes every client who visited during the selected period, works out each client's stage at the start and at the end of that period, and shows the movement between the two. Everything is based on the trailing 365 days of history — there's no all-time view.
The five stages
| Stage | Definition |
|---|---|
| New | First-ever visit fell inside the period. |
| Reactivated | Was lapsed at the start of the period, then visited during it. |
| Returning | Active, with 2–5 visits in the last year. |
| Loyal | Active, with 6+ visits or £1,000+ spend in the last year. |
| Lapsed | No visit in 180+ days. |
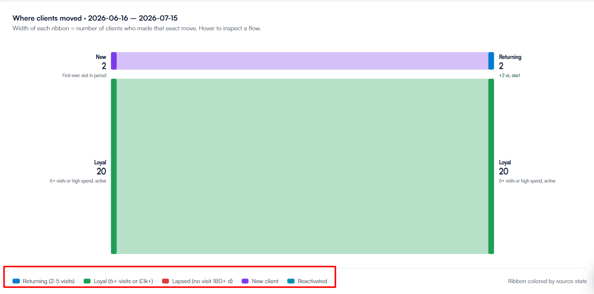
NOTE: "Active" means Returning or Loyal, and a "visit" is any appointment that wasn’t cancelled, moved, or marked as a no-show. The 180-day lapse test comes first — a client with plenty of visits in the past, but none recently, is still counted as Lapsed.
The KPIs
- Net Active Change – active clients at the end of the period minus active clients at the start.
- New Clients – first-ever visits recorded in the period.
- Graduations to Loyal – clients who moved from Returning to Loyal.
- Reactivations – lapsed clients who came back.
- Newly Lapsed – active clients who went quiet by the end of the period.
- One-and-done Rate – of your new clients, the share who had exactly one visit and no follow-up.

What you see
Above the diagram sits a segmented control with the same four presets as the Period filter (Last 30 days, Last quarter, Year to date, Trailing 12 mo). It highlights the window you’ve selected — use the Period filter at the top of the report to actually change it. The same bar also shows how many clients touched the clinic in the window and the total number of state transitions.
The "Where clients moved" panel is a flow (Sankey) diagram with starting stages on the left, ending stages on the right, and ribbons showing how many clients moved along each path (for example, "Returning → Loyal") — the wider the ribbon, the more clients made that exact move.
Alongside it, a movement summary shows the new, reactivated, graduated, and newly lapsed figures at a glance.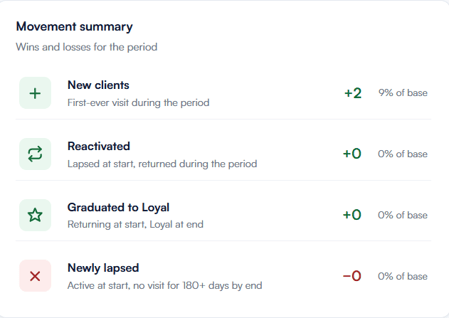
The transition matrix
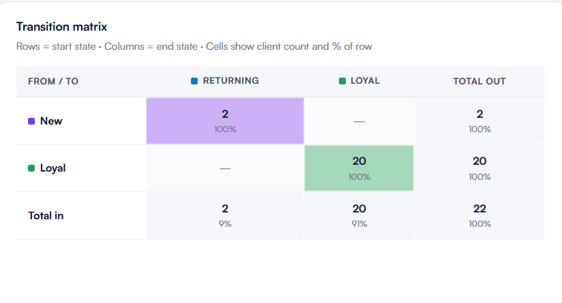
Next to the movement summary, the "Transition matrix" panel shows the same movement as a grid: rows are the starting state, columns are the ending state, and each cell shows the number of clients who made that move plus the percentage of the row it represents.
Insight cards
Three insight cards at the bottom pull out the headlines: how many clients graduated from Returning to Loyal this period, how many new clients are still "one-and-done" without a second visit, and a recap of how the lifecycle states are assigned.
By following these steps, you can use the Client Lifecycle Flow report to see exactly how your client base is moving — who's coming in, climbing up, or drifting away — over any period you choose. To act on the clients who are slipping, pair it with the At-Risk Clients report; for the money view of retention, see the Client Revenue Retention report.
Was this guide helpful? Let us know by voting below - your feedback helps us write clearer articles.
For more guides, browse the related articles below or use the search bar at the top of the page. You can also watch our video learning series, the Pabau Academy, or visit the Support page for additional help.