
The At-Risk Clients report flags existing clients who look like they're drifting away, so you can reach out before they're lost. It answers one question: which of your regular clients are overdue for a visit compared to their own personal rhythm, and how much future revenue is at risk?
The key idea behind the report is that every client has their own personal visit cadence — the typical gap, in days, between their completed visits. A client is flagged as "at risk" when the time since their last visit has stretched past their own normal cadence. It's not a fixed "hasn't visited in X weeks" rule for everyone — it's personalised to each client.
How to find it
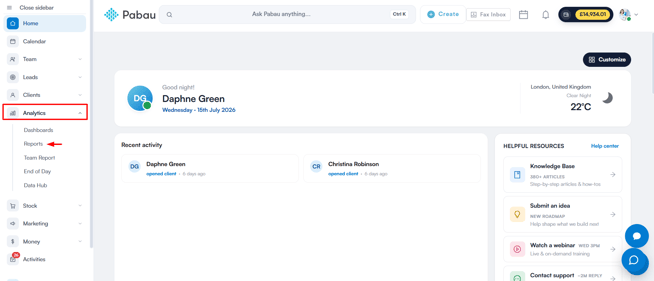
Step 1: Navigate to the Analytics Feature
Log in to your Pabau account, and in the left sidebar menu, go to Analytics, then click on the "Reports" button.
Step 2: Access the reports banner
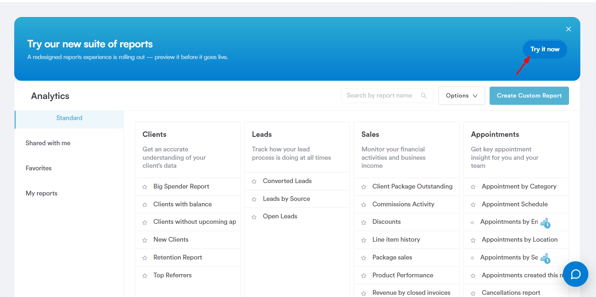
On the "Try our new suite of reports" banner, click Try it now.
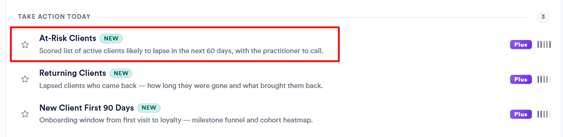
Once you're in the new reports view, go to the Clients section then scroll to the "Take action today" group and click on At-Risk Clients to open the report. The tile carries "New" and "Plus" badges — At-Risk Clients is one of the Plus reports, and you’ll also find it on the Featured tab under "Pabau featured reports".
Filters
- Period – The date range being analysed. Must be 365 days or less; there's no all-time option. Presets cover Last 30 days, Last quarter, Last 6 months, and Last 12 months, and the default is the last 90 days.
- Location – Exactly one location — there's no "all locations" mode.
- Treatment Category – Narrows the report to clients whose visits fall in the chosen categories.
- Primary Practitioner – Narrows the report to a single staff member.
- Risk Tier / Search – Filters the list to High (7+), Medium (4–6), or Low (1–3) scores, or searches by client name or reference.

NOTE: The one-location and 365-day limits exist because, on large clinics, this report scans millions of appointments — without those limits, it would time out.
Understanding the report
The KPIs
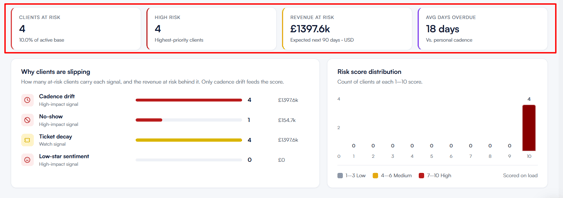
There are four KPI cards at the top of the report:
- Clients at Risk – how many clients in your selection are currently overdue against their own cadence. The card's sub-label shows them as a percentage of your active base (clients with at least one visit in the last 12 months at that location).
- High Risk – how many of those score 7 or above.
- Revenue at Risk – the estimated spend you stand to lose, summed across all at-risk clients. Per client, this is their expected spend over the next 90 days, based on their historic spend-per-visit and how often they normally come in.
- Avg Days Overdue – the average number of days past their personal cadence, across all at-risk clients.
How a client qualifies, and how the score works
- Only clients with at least 3 completed visits are considered — anyone with fewer is excluded, since there isn't enough history to establish a rhythm.
- A "visit" means a completed/attended appointment (Complete, Complete - No VAT, Checked-in, or Arrived). Multiple appointments on the same day count as one visit.
- Personal cadence is the median gap, in days, between a client's consecutive visits.
- A client is only flagged at-risk if the days since their last visit is greater than their personal cadence.
- Risk score (1–10) is roughly (days since last visit ÷ personal cadence) × 5, capped between 1 and 10 — the more overdue relative to their own rhythm, the higher the score.
- Tiers: High = 7–10, Medium = 4–6, Low = 1–3.
Table columns
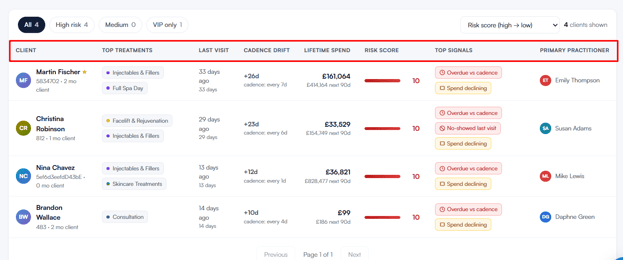
| Column | Meaning |
|---|---|
| Client | Name and ID; VIPs are flagged. |
| Top treatments | Their two most-frequent treatment categories. |
| Last visit | Days since their last completed visit. |
| Next visit | The date and time of their next booked appointment, or "-" if nothing is booked. |
| Cadence drift | How overdue they are versus their personal cadence. |
| Lifetime spend | Total they've ever paid. |
| Risk score | 1–10, as explained above. |
| Top signals | Which warning signs apply (see below). |
| Primary practitioner | The staff member they see most. |
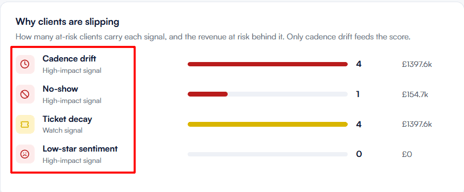
The four "signals"
Apart from cadence drift — which is what the score itself is built on — these are informational only; they don't change the risk score.
- Cadence drift – always on for anyone in this list, since that's what put them here.
- No-show – had a no-show in the period.
- Ticket decay – recent spend-per-visit has dropped below 75% of their lifetime average.
- Low-star sentiment – left a 1–2 star survey rating.
The "Why clients are slipping" panel near the top of the report breaks these signals down: for each one, it shows how many at-risk clients carry that signal and the revenue at risk behind it. Only cadence drift feeds the risk score — the other three are extra context.
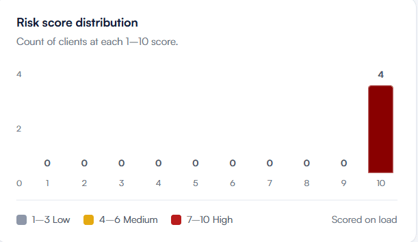
Next to that panel, the "Risk score distribution" histogram shows how many clients sit at each score from 1 to 10.
Working with the list
Above the table, a chip strip lets you narrow the list to All, High risk, Medium, or VIP only — each chip shows a live count. Next to it, a sort dropdown reorders the list by Risk score, Revenue at risk, Most overdue first, or Lifetime spend.
Insight cards
Two insight cards at the bottom of the report add context to the list: one reminds you that a recent no-show is a strong warning sign worth a closer look, and the other suggests sorting by Revenue at risk to surface high-value VIPs who are drifting past their usual rhythm.
Exporting the report
Use the Export button at the top of the report to download the list as an Excel or CSV file. The export includes the full at-risk list that matches your filters — not just the page you’re viewing on screen.
By following these steps, you can use the At-Risk Clients report to spot which regular clients are drifting away and prioritise outreach before you lose them. For the bigger picture of how your whole client base is moving between stages, pair it with the Client Lifecycle Flow report.
Was this guide helpful? Let us know by voting below - your feedback helps us write clearer articles.
For more guides, browse the related articles below or use the search bar at the top of the page. You can also watch our video learning series, the Pabau Academy, or visit the Support page for additional help.